Figure 5.
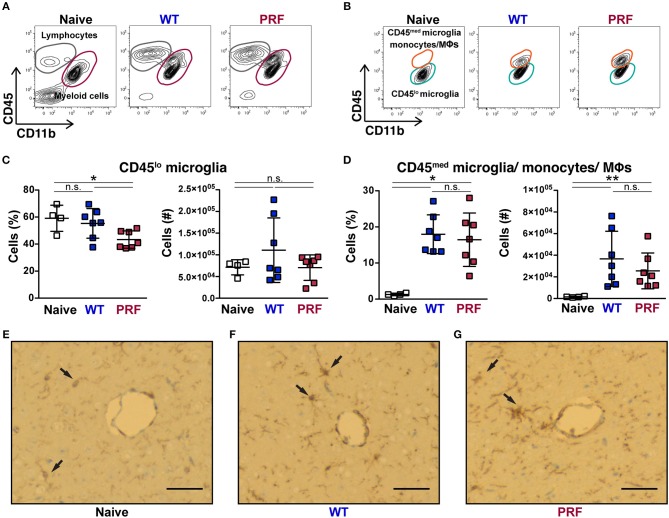
Quantification of myeloid cells after infection. (A) Representative contour plots from day 8 after infection showing CD45 vs. CD11b expression on live cells obtained from naïve mice (left), and mice infected with WT (center) and PRF (right) sporozoites. Indicated are gated populations of lymphocytes, CD45hiCD11b− cells (gray circles) and myeloid cells, CD45med/loCD11b+ cells (red circles). (B) CD45 vs. CD11b expression on the Ly6G− myeloid population. CD45loCD11b+ cells (orange circles) represent microglia and CD45medCD11b+ cells (green circles) activated microglia, monocytes and macrophages, respectively. (C) Quantification of CD45lo microglia. Shown are percentage (left) and absolute numbers (right) of CD45loLy6G−CD11b+ microglia. (D) Quantification of CD45medLy6G−CD11b+ cells, which correspond to CD45med microglia, monocytes and macrophages. Shown are percentage (left) and absolute numbers (right) of CD45med microglia/monocytes/macrophages in the brain. The scatter dot plots in (C,D) represent mean values (±SD) from samples (n = 4–7) isolated 8 days after infection from two independent experiments. n.s, non-significant; *P < 0.05; **P < 0.01 (Mann-Whitney test). (E–G) Representative images from the IBA-1+ microglial cells of brain histological cross-sections. Cerebral vessels are indicated by arrows. The IBA-1 staining reaction was visualized with diaminobenzidine (DAB), highlighting some microglial cells with thin processes in naïve mice, while they are more prominent in WT sporozoite-infected mice and they also tend to cluster around vessels. This feature is also pronounced in PRF sporozoite-infected mice, dark brown. Scale bar, 50 μm.

