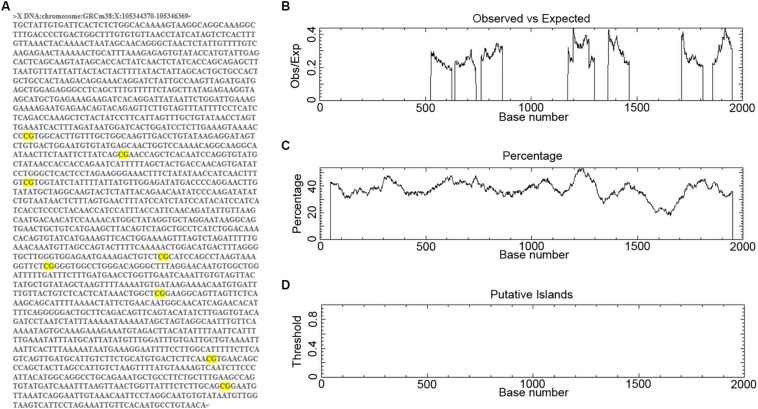
FIGURE 1.
Analysis of CpG islands in Mir384 promoter. (A) The DNA sequence 2000 bp upstream of Mir384 in chromosome X. CG dinucleotides are marked in bright yellow. (B–D) Mir384 promoter sequence is analyzed by EMBOSS Cpgplot for CpG islands prediction, and the ratio of observed to expected (B), percentage of CG (C), and putative CpG island (D) are shown.

