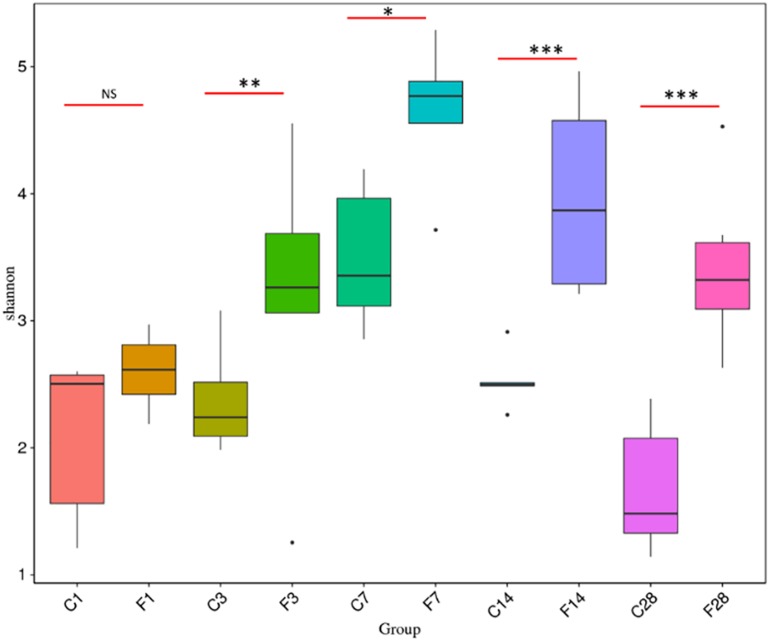
FIGURE 3.
Comparison of Shannon Index based on the genera profile in different groups (C, the group treated with saline; F, the group treated with influenza virus; the number followed C/F represented the day post inoculation). There were 5–6 mice in each group, and each sample was analyzed independent (∗p < 0.05, ∗∗p < 0.01, and ∗∗∗p < 0.001, NS no significant compared with CON).

