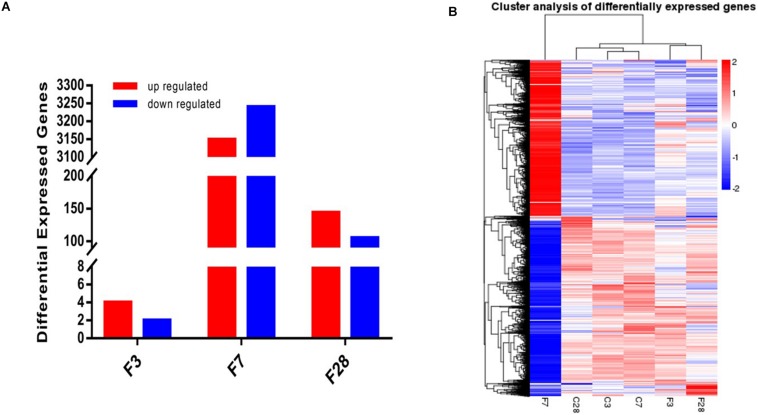
FIGURE 7.
Whole transcriptome analysis of lungs exposed to influenza virus/saline showing (A) 6, 6389 and 249 DEGs in the H1N1-infected mice on 3, 7, and 28 dpi, and (B) gene clustering based on expression levels (FPKM). Blue color indicates the low-expressed-level genes and red color the high-expressed-level genes in the whole data set (C, the group treated with saline; F, the group treated with influenza virus; the number followed C/F represented the day post inoculation. n = 3 per group).

