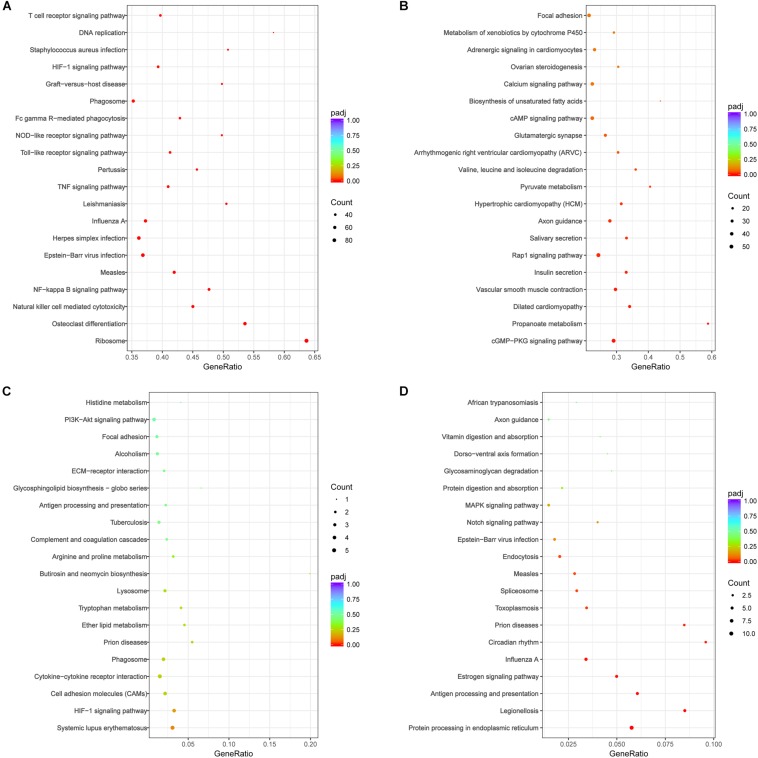
FIGURE 8.
KEGG pathway analysis of DEGs following H1N1 infection revealed significant pathways (padj < 0.05) involved in local immune responses and cell adhesion molecules in the lung of mice on (A,B) 7 and (C,D) 28 dpi. (A) The enrichment pathways of up-regulated genes at 7 dpi; (B) the enrichment pathways of the down-regulated genes at 7 dpi; (C) the enrichment pathways of up-regulated genes at 28 dpi; (D) the enrichment pathways of down-regulated genes at 28 dpi. The size of the circle indicated the number of the genes. The color of the circle indicated Q value. Gene Ratio refers the ratio of Sample number and Background number enriched in the pathway. The value range of adjusted P-value (padj) is [0,1], and the closer to zero, the enrichment is more significant.

