
Fig. 2.
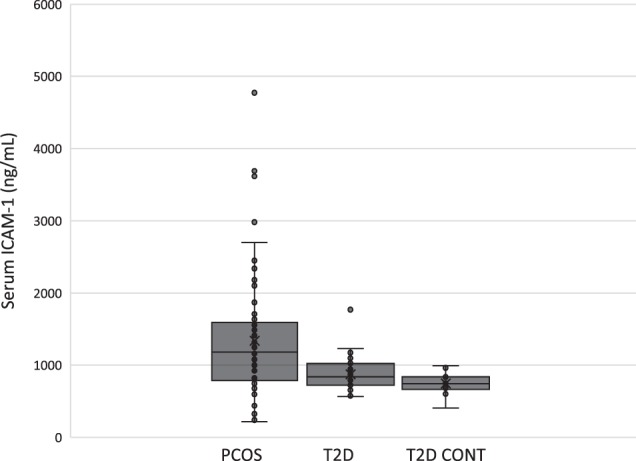
Serum ICAM-1 levels in PCOS (n = 37), T2D (n = 56) and control groups (n = 18) as determined by ELISA. Horizontal bar within the box represents the median, ‘x’ denotes mean
Official websites use .gov
A
.gov website belongs to an official
government organization in the United States.
Secure .gov websites use HTTPS
A lock (
) or https:// means you've safely
connected to the .gov website. Share sensitive
information only on official, secure websites.
Serum ICAM-1 levels in PCOS (n = 37), T2D (n = 56) and control groups (n = 18) as determined by ELISA. Horizontal bar within the box represents the median, ‘x’ denotes mean