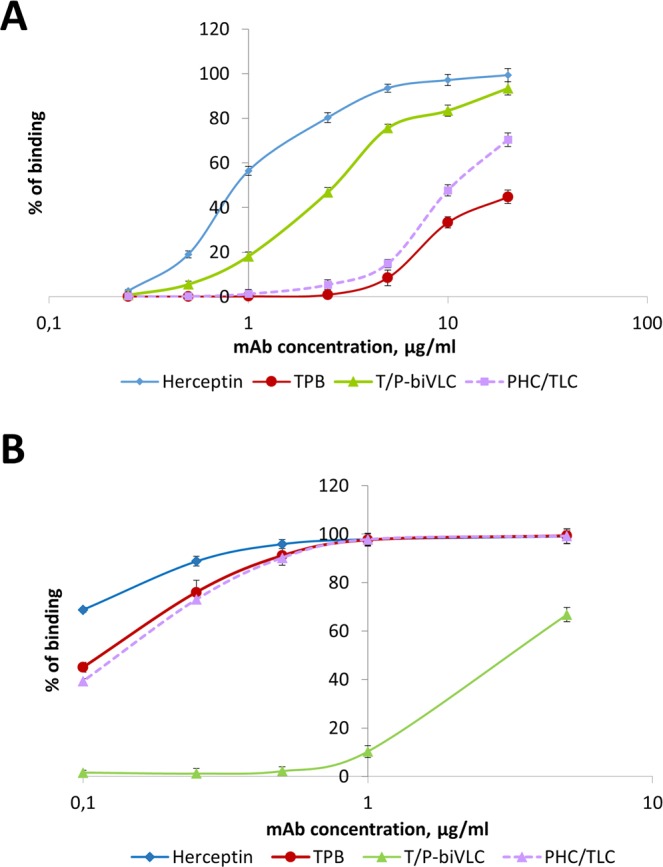
Figure 2.

Analysis of the affinities of TPB and the bispecific antibodies T/P-biVLC and PHC/TLC to the FcγRIIIa (A) and HER2 oncoprotein (B) on the cell surface as shown by flow cytofluorimetry. (A) Binding of TPB, T/P-biVLC and PHC/TLC to СНО-К1.С16-cells with exposed FcγRIIIa on the surface. Herceptin is used as control. Cells were incubated with antibodies at concentrations from 0.25 to 20 µg/ml. The ordinate axis corresponds to the percentage of cells bound to antibodies as indicated by fluorescein isothyocyanate (FITC) fluorescence. The mean values with standard errors are indicated. (B) Binding of TPB, T/P-biVLC and PHC/TLC to HER2 oncoprotein on the surface of BT-474 cells. Herceptin is used as control. Cells were incubated with antibodies at concentrations from 0.1 to 20 µg/ml. The ordinate axis corresponds to the percentage of cells bound to antibodies as indicated by FITC fluorescence. The mean values with standard errors are indicated.
