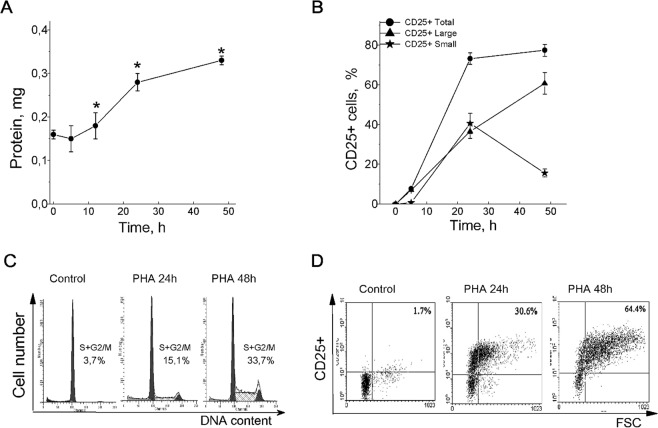
Figure 2.
Long-term increase in cell K+ content precedes DNA synthesis and accompanies transformation of small T cells into large blasts. (A) The protein content increase in PBL stimulated by PHA (10 µg/ml) for 48 hours. Data are means ± SEM of twelve experiments performed triplicate. *Significant difference from the initial value at time 0 (resting PBL) was tested by one-way ANOVA with Tukey’s post hoc tests, P < 0.05. (B) The time course of CD25 expression on small and large PBL stimulated by PHA. Data are means ± SEM of one representative experiment of three. (C) Flow cytometric analysis of cell cycle phase distribution in PHA-stimulated PBL: the percentage of cells in S and (G2 + M) phases. (D) The time course of CD25 expression in PBL stimulated by PHA for 48 hour. Resting or PHA-stimulated PBL were stained with PE-labeled CD25 Abs and analyzed by flow cytometry. (C) and (D) – representative data of three experiments with PBL from different donors. Control - non-stimulated, resting PBL.

