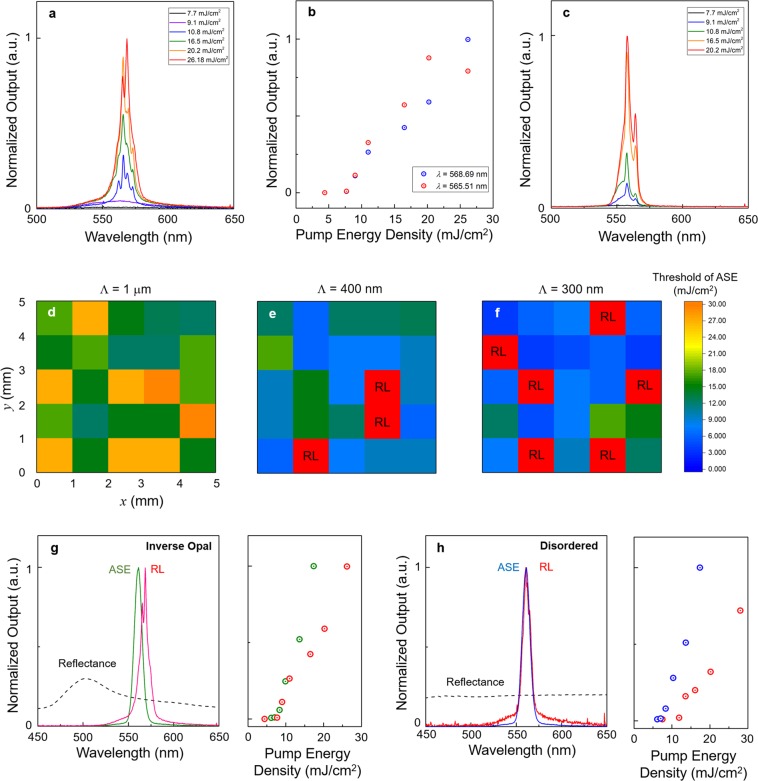
Figure 3.
RLs from the SIOs. (a) Evolution from PL to RL with increasing pump intensity in the SIO. (b) The threshold behaviors of two RL modes shown in (a,c) RL spectra measured on different pumping spots of the same SIO in a. (d–f) ASE threshold distributions from the SIOs with different sizes of air voids (Λ = 1, 0.4, and 0.3 μm). As the size of air voids was decreased, the ASE threshold was reduced, and it was easier to obtain RLs. (g,h) Spectra and light-in versus light-out (LL) curves of ASE and RL from the ordered and disordered SIOs. All the samples were made using PMMA spheres with a 300-nm diameter. The reflectance spectra were merged in the ASE and RL spectra plots to show the existence of the photonic band gap related to the orderness of the SIO.

