Fig. 1.
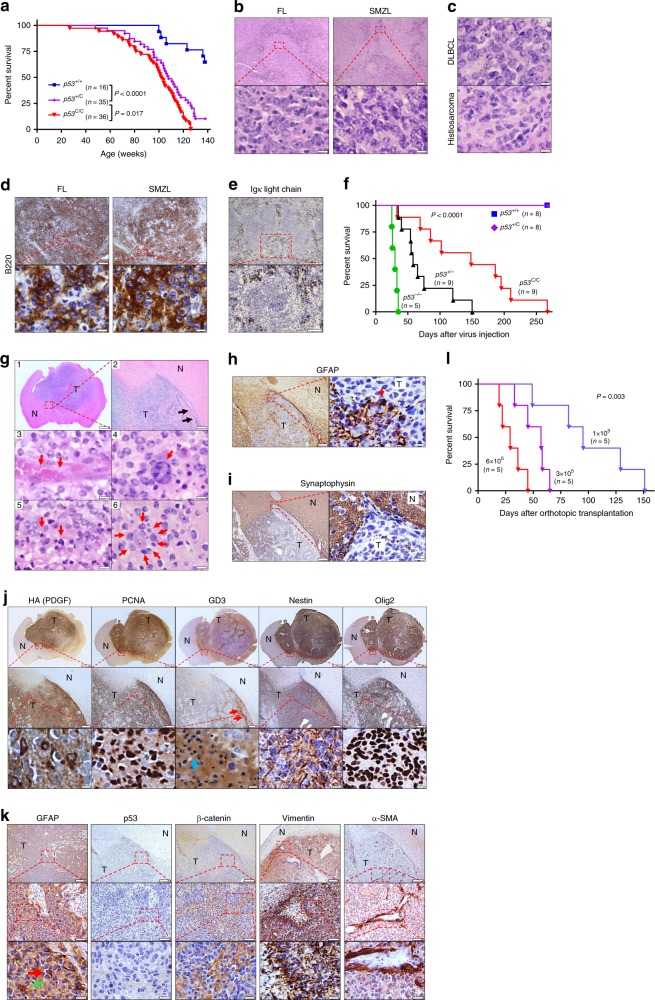
p53C accelerates spontaneous tumorigenesis and gliomagenesis in mice. a Survival of p53 polymorphic mice. P < 0.0001 (log-rank test). b Hematoxylin and eosin stain (H&E) staining of representative follicular lymphoma (FL) and splenic marginal zone lymphoma (SMZL) in polymorphic mice. Scale bar = 200 μm (top), 20 μm (bottom). c Diffuse large B-cell lymphoma (DLBCL, top) and histiosarcoma (bottom). Scale bar = 20 μm. d Immunohistochemistry (IHC) staining for B-cell marker B220 in FL and SMZL. Scale bar = 200 μm (top), 20 μm (bottom). e IHC staining for Ig κ light chain of SMZL. Scale bar = 200 μm (top), 50 μm (bottom). f Survival of polymorphic mice injected in the right subventricular zone (SVZ) with retrovirus carrying Pdgfb. P < 0.0001 (log-rank). g H&E of glioma in p53C/C mice (n = 9). 1, a representative tumor (magnification 2 × ). Scale bar = 1 mm. 2, invasive growth of the tumor cells. Arrows showing invasion front of the tumor. Scale bar = 100 μm. 3, a blood vessel (arrows) in the tumor tissue (×1000). 4, infiltrating monocytes (arrow) within tumors. 5, Necrotic tumor cells (Arrows). 6, highly invasive tumor cell (arrows) growth surrounding a neuron (star). Scale bar = 5 μm in 3–6. h IHC for the astrocyte/glial cell marker GFAP. Arrow showing a tumor cell staining positive for GFAP, but most tumor cells lost GFAP expression. i IHC of synaptophysin. Scale bar in (h, i) = 100 μm (left), 10 μm (right). j IHC of glioma stem cell markers in p53C/C mice. Pdgfb was tagged with 3× hemagglutinin (HA). PCNA: tumor cell proliferation, GD3, Nestin, and Oligo2: neuralgia progenitor/glioma stem cell maker (red arrows point to the accumulation of GD3 at invasive front line; blue arrow: necrotic cells). Scale bars = 1 mm (top), 100 μm (middle), and 5 μm (bottom row). k IHC of other markers in p53C/C mice. Green arrow: GFAP-positive cell with typical astrocyte morphology, red arrow: GFAP-positive tumor cell. Scale bars = 100 μm (top), 20 μm (middle), and 5 μm (bottom). N normal tissues, T tumors. Images were representative of staining six tumors (one per animal) (g–k). l Survival of syngeneic WT mice orthotopically transplanted with p53C/C glioma cells (f). P = 0.003 (log-rank)

