Fig. 2.
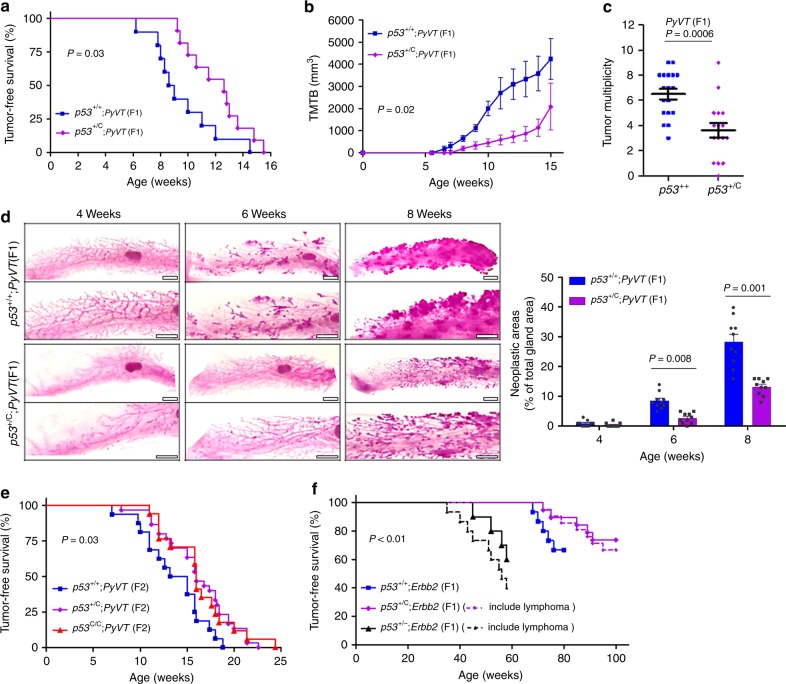
p53C delays either PyVT- or Errb2-driven mammary tumorigenesis in mice. a Tumor-free survival of F1 female offspring of p53+/C mice crossed with PyVT-overexpressing mice (FVB/N-Tg(MMTV-PyVT)634Mul/J). n = 10 for p53+/+;PyVT and n = 11 for p53+/C;PyVT; P = 0.03 (log-rank test). b Tumor volume in F1 female p53+/+;PyVT and p53+/C;PyVT mice at indicated ages. TMTB total measured tumor burden. P = 0.02 (Mann–Whitney U test). c Tumor multiplicity in F1 females at 15 weeks. The data were presented as mean ± s.e.m., error bars depict s.e.m.; P = 0.0006 (Mann–Whitney U test). d Whole-mount carmine red stain of the mammary glands from F1 females at indicated ages. n = 5 mice per group. Scale bar, 2 mm. On the right was the quantification of neoplastic/hyperplastic areas as a percentage of the total gland areas as shown (left) using image analysis. The data were presented as mean + s.e.m., error bars depict s.e.m. (n = 10 mammary gland from five mice per group) and analyzed with two-sided Student’s t test. e Tumor-free survival of F2 female offspring (obtained by crossing F1 p53+/C;PyVT with F1 p53+/C mice). P = 0.03 (log-rank test). f Mammary tumor-free survival and tumor-free survival of F1 female offspring from Erbb2 mice interbred with p53+/C mice. As p53+/C and p53+/− mice may develop lymphoma, dashed lines indicated tumor-free survival (P = 0.006, log-rank test) and solid lines indicated mammary tumor-free survival (P < 0.001, log-rank test), i.e., dashed lines included 2 of the 21 p53+/C;Erbb2 mice and 5 of the 15 p53+/−;Erbb2 mice that developed lymphomas. p53+/−;Erbb2 mice, as a control, were obtained by breeding p53−/− mice with Erbb2 mice

