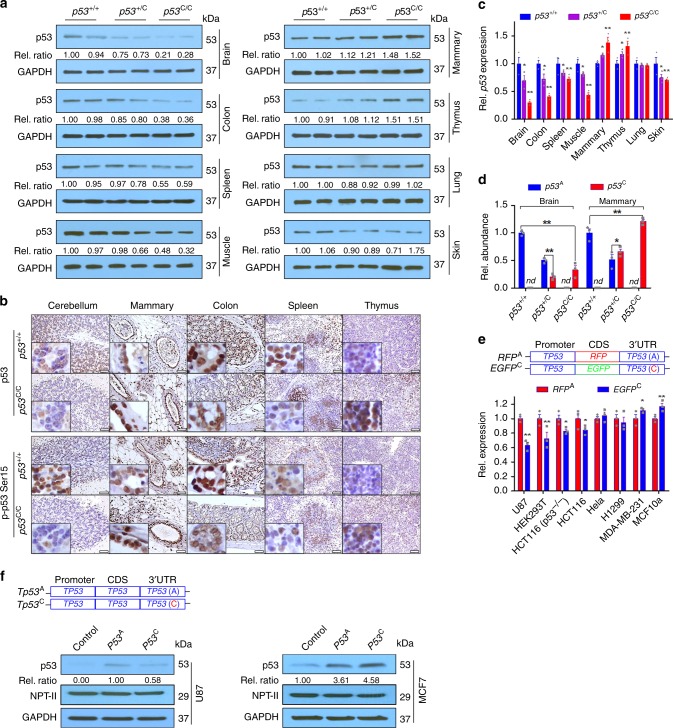
Fig. 3.
Differential p53 deregulation by the p53C allele in tissues and cell lines. a Western blotting analyses for p53 protein levels in tissues from mouse littermates. Each pair of lanes indicates samples from two different mice. Rel. ratio: the relative signal densities of p53 as referenced to that of GAPDH. b IHC staining for p53 (upper panel) and phosphorylated p53 at site Ser15 (lower panel) in p53+/+ and p53C/C mice. Mice were treated with 4 Gy total body γ-irradiation, and the brain, mammary gland, colon, spleen, and thymus were collected 6 h later for IHC staining. Scale bar, 50 μm. n = 3 mice per group, inserts show high-magnification (×400) images. c Quantitative real-time PCR (qPCR) analysis for p53 mRNA levels in mouse tissues. Rel. p53 expression: Relative p53 mRNA levels normalized to Gapdh. The data were presented as mean ± s.e.m.; n = 3 independent biological replications. d Relative abundance (Rel. abundance) of A and C p53 cDNA alleles as determined by sequencing the PCR product of p53 cDNAs reverse transcribed from total mRNAs extracted from the brain and mammary tissues of mouse littermates. nd not detectable. e qPCR analysis for EGFP/RFP mRNA levels from indicated cell lines transfected with EGFPC or RFPA, with neomycin phosphotransferase (NPT-II) as a reference, a gene carried by the vector. CDS, coding sequence. Rel. expression: Relative expression. The data were presented as mean ± s.e.m.; n = 3 biological triplicates for each cell line. c–e *P < 0.05, **P < 0.01 (one-way ANOVA). Error bars depict s.e.m. f Western blotting analyses for p53 protein levels in MCF7 and U87 cells transfected with a plasmid expressing TP53 with a WT 3′UTR (TP53A) or a 3′UTR with an alternative PAS (TP53C). Rel. ratio: the relative signal densities of p53 as referenced to that of NPT-II. n = 3 biological triplicates for each cell line. a, f Source data from Western blotting are provided in a Source Data file

