Figure 5.
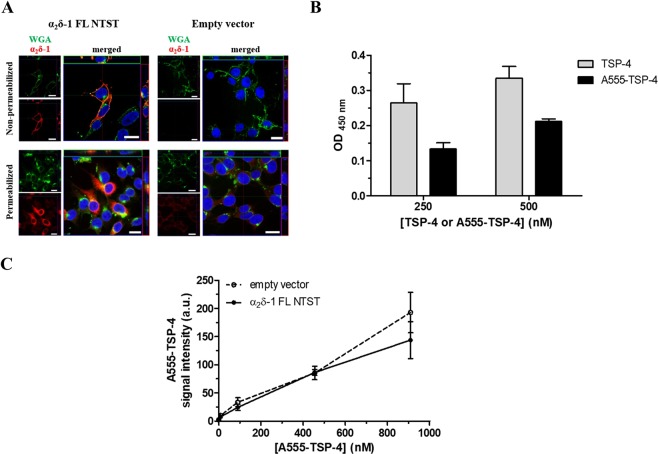
Fluorescent A555-TSP-4 protein does not bind to membrane-bound α2δ-1 in HEK293-EBNA cells. (A) Representative confocal images of the immunocytochemical detection of membrane-localised α2δ-1 FL NTST over-expressed in HEK293-EBNA cells. Cells were transfected with either empty vector (right column) or vector encoding full-length α2δ-1 containing an N-terminal strep II-tag (α2δ-1 FL NTST, left column). Cells were stained either without permeabilisation (upper row) or after membrane permeabilisation (lower row). Signals of WGA conjugated with Alexa Fluor 633 (green) and α2δ-1 (red) are shown individually in the small images; merged signals are shown in the large images. DAPI was used to visualise the nucleus (blue). Images show top view as well as upper-side (green box) and right-side (red box) views of a single slice of scanning near the middle of cells. Scale bar is 20 µm for all images. (B) Binding of A555-TSP-4 or TSP-4 to α2δ-1S NTST analysed by an ELISA-style ligand binding assay. α2δ-1S NTST (20 µg/ml) was coated onto 96-well plates and incubated with either TSP-4 or A555-TSP-4 at two different concentrations (250 and 500 nM) for each protein. Specific binding was calculated by subtracting OD values of non-specific binding from those of total binding. Data represent mean ± SEM of 2 independent measurements, each performed in duplicate. OD values for specific binding of TSP-4 and A555-TSP-4 were subjected to unpaired Student’s t-test. No significant difference was found (P > 0.05) for each of the two concentrations of both TSP-4 species used. (C) Cells transfected with either empty vector or vector encoding α2δ-1 FL NTST were incubated with increasing concentrations of A555-TSP-4 (final concentration: 9–909 nM) in 96-well imaging plates. Control wells received the same volume of dilution medium (40 µl) without A555-TSP-4. Average A555-TSP-4 fluorescent signal intensities from wells containing cells transfected with α2δ-1 FL NTST encoding vector or empty vector (±SEM of 3 independent experiments, each performed in triplicate) were plotted versus the A555-TSP-4 concentration.

