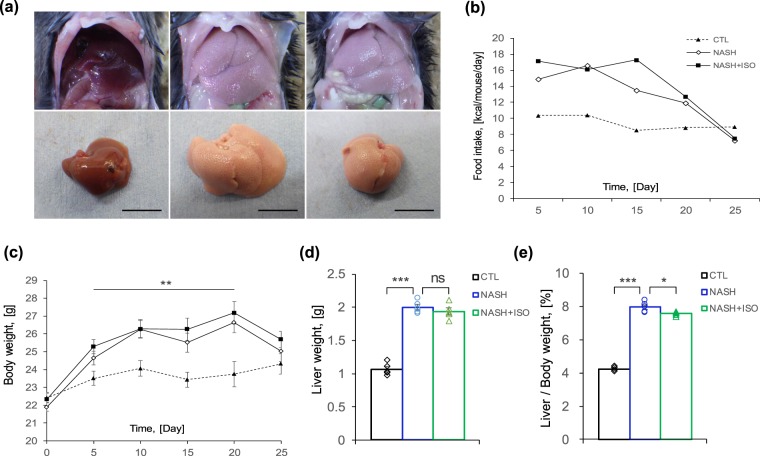
Figure 1.
Biometrics of NASH-induced mice treated with isorhamnetin. (a) Representative liver aspect of experimental groups: control (CTL), NASH-induced (NASH), and NASH-induced with isorhamnetin treatment (NASH + ISO) group (scale bar = 1 cm). (b) Average food intake in calories of experimental groups presented as kcal per mouse per day (n = 8/group). (c) Body weight change (n = 8/group). (d) Effect of isorhamnetin on liver weight (n = 5/group, NASH vs. NASH + ISO: p = 0.389) and (e) liver on body weight ratio (n = 5/group, NASH vs. NASH + ISO: p = 0.025). Data are shown as mean ± SEM with significance *p < 0.05, **p < 0.01, ***p < 0.001 and ns = non-significant.

