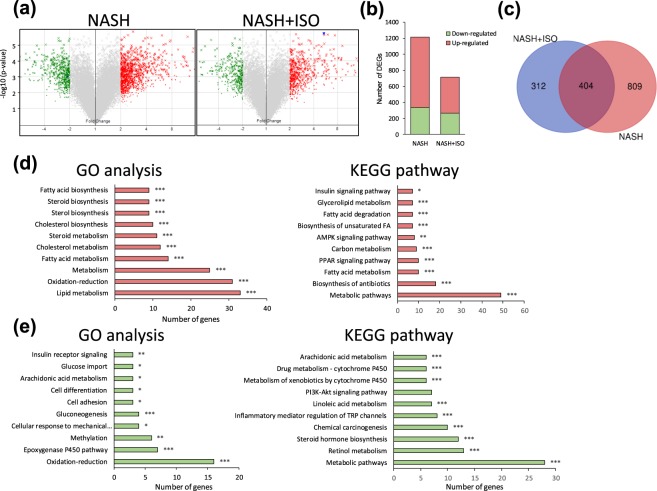
Figure 3.
Hepatic gene expression profile in NASH and NASH + ISO group compared to CTL group. (a) Volcano plot of DEGs with fold-change over ± 2.0 (green: down-regulated, and red: up-regulated genes) between NASH vs. CTL, and NASH + ISO vs. CTL. (b) Quantitation of number of DEGs. (c) Venn diagram showing the overlap of DEGs between NASH vs. CTL, and NASH + ISO vs. CTL. GO process analysis and KEGG pathway for the up-regulated 257 genes (d) and down-regulated 147 genes (e) from overlapping 404 DEGs with p-value as *p < 0.05, **p < 0.01, ***p < 0.001.

