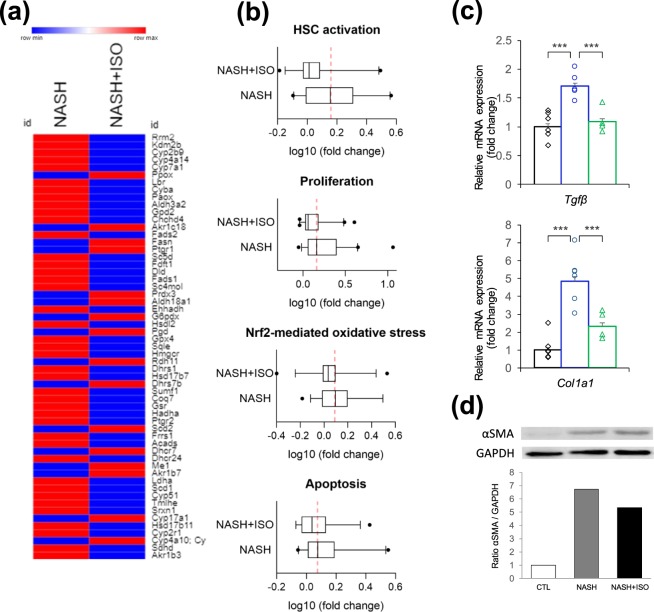
Figure 5.
Changes in oxidation reduction process and activation of HSCs. (a) Heat map showing DEGs involved in oxidation reduction process between NASH and NASH + ISO compared to CTL group. (b) Box plot with median averaging genes involved in HSC activation (26 genes averaged), proliferation (41 genes averaged), Nrf2-mediated oxidative stress (38 genes averaged), and apoptosis (24 genes averaged). Red dash line shows the median of NASH group (c). Relative mRNA expression level of TGFβ and collagen type I genes (n = 4–6/group) by qPCR analysis. Data are shown as mean ± SEM with significance ***p < 0.001. (d) Immunoblot analysis for αSMA in liver tissue and quantification of band intensities normalized to GAPDH.

