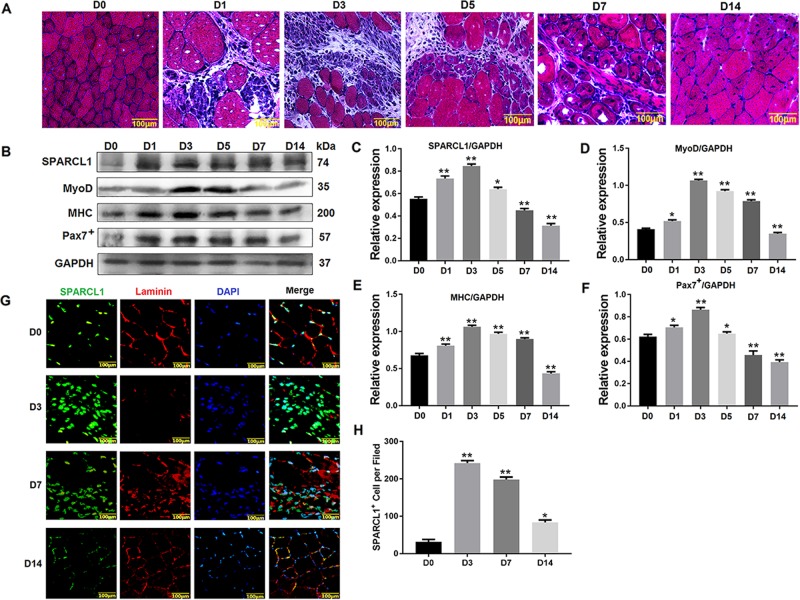
Fig. 2. SPARCL1 expressed in mice muscle injury model.
a shows HE staining of TA muscles injury. b shows the Protein expression changes of SPARCL1 in muscle damage repair, MyoD, MHC, Pax7+ are marker molecules involved in cell differentiation, c–f are grayscale scans of the relevant proteins in b. g shows the SPARCL1 expressed in mouse muscle injury model. The green fluorescent signal is SPARCL1, red fluorescent signal is laminin, and blue fluorescent signal is cell nucleus. H shows statistical data for positive cell number based on SPARCL1 expression in 2G. Five fields of view per experimental group were used to analyse SPARCL1 expression in TA muscle cells. D0, D1, D3, D5, and D7 represent TA muscle damage on days 0, 1, 3, 5, and 7, respectively. The scale bar in A and B is 100 μm. **P values < 0.01 and *P values < 0.05 were considered as significant

