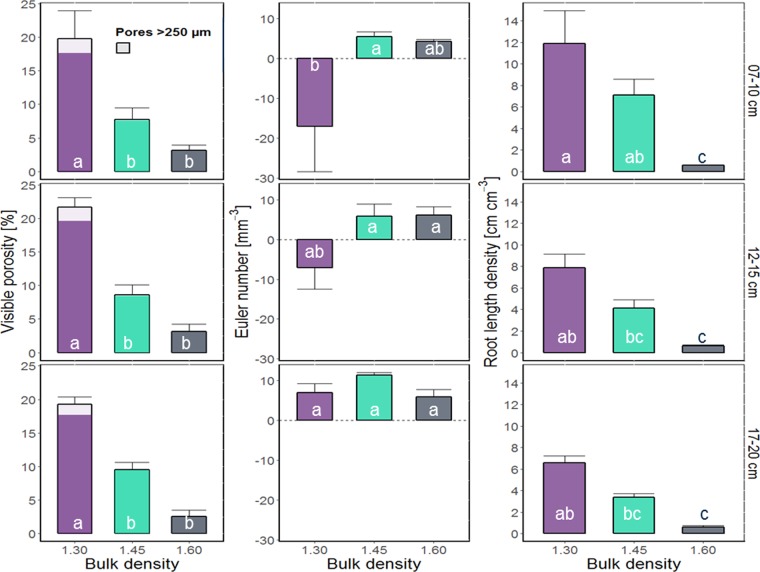
Figure 3.
Mean values and standard errors (whiskers) of visible porosity, Euler number and root length density for each of the three different treatments (bulk density of 1.30, 1.45, and 1.60 g cm−3) and depth within column (7–10 cm, 12–15 cm, 17–20 cm) derived from µCT-scans of 3 cm samples. Visible porosity shows pores >38 µm (two voxels), the Euler number shows the connectivity of pores >76 µm. Different letters indicate significant differences (n = 5). Inset shows the subsampling scheme.

