Figure 5.

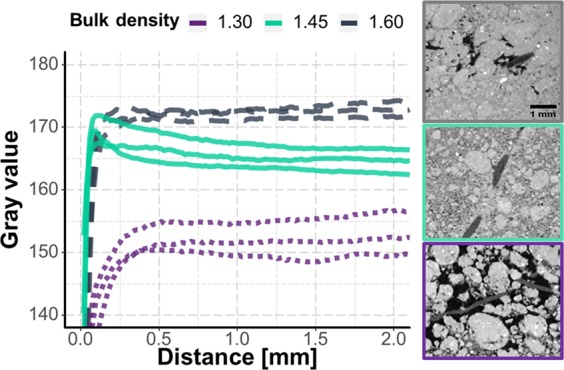
Change of gray values with distance to the roots for three random subsamples for each of the three treatments (bulk density of 1.30, 1.45, and 1.60 g cm−3) and corresponding µCT slices showing roots within the different compacted soils.

Change of gray values with distance to the roots for three random subsamples for each of the three treatments (bulk density of 1.30, 1.45, and 1.60 g cm−3) and corresponding µCT slices showing roots within the different compacted soils.