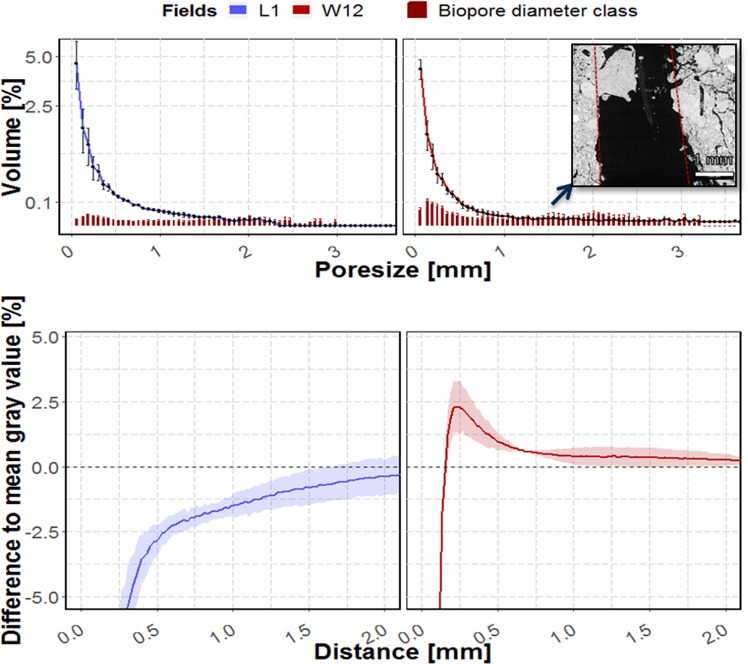
Figure 9.
Mean volume of biopore and pore diameter classes (upper graphs) and change in gray value with the distance to the biopore surface relative to the mean gray value of a sample (lower part). Samples are taken on a 1 year old field (blue) and a 12 year old field in 40–60 cm depth on the chronosequence. Inset shows a filled biopore and how the tubeness filter would assign the borders of this biopore (red line). Shadows and whiskers indicate the standard deviation (n = 3 plots, which in turn each are determined by the result of 9 µCT scans).

