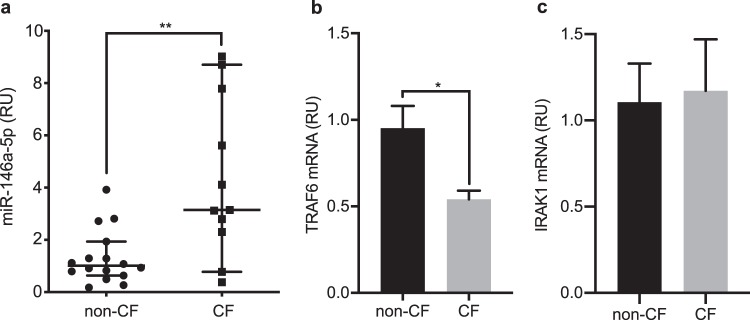
Figure 2.
Up-regulation of miR-146a and down-regulation of TRAF6 mRNA in CF macrophages. (a) MiR-146a levels were measured using RT-qPCR in non-CF (n = 16) and CF (n = 11) macrophages. The data were normalised to expression of the RNU6B endogenous control. Each symbol represents a single individual. **p < 0.01 (Mann-Whitney tests) (b,c) TRAF6 and IRAK1 mRNAs were evaluated using RT-qPCR in non-CF (n = 8) and CF (n = 8) macrophages. The data were normalised to expression of the endogenous β-actin control. Data are means ± SEM. *p < 0.05 (unpaired t-tests).

