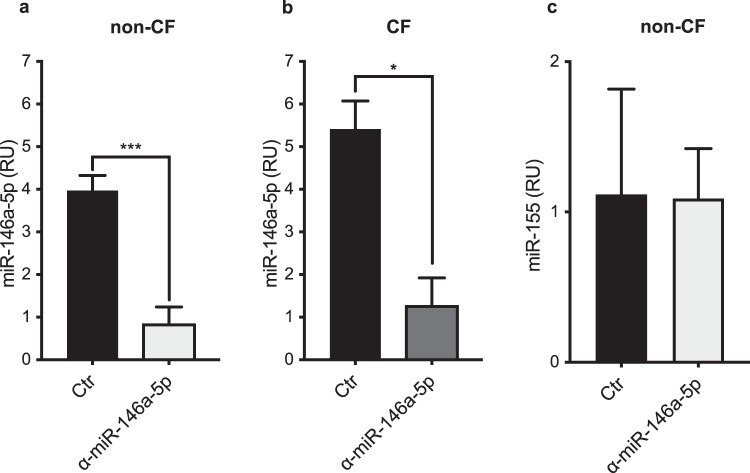
Figure 3.
Knock-down of miR-146a in non-CF and CF macrophages. (a,b) MiR-146a expression level in LPS-stimulated non-CF and CF macrophages. (c) MiR-155 expression in LPS-stimulated non-CF macrophages. MiRNAs were quantified 16 h after transfection with either the miR-146a inhibitor (α-miR-146a-5p) or the control inhibitor (Ctr) (n = 3). The data were normalised to expression of the endogenous RNU6B control. Data are means ± SEM. *p < 0.05; ***p < 0.001 (unpaired t-tests).

