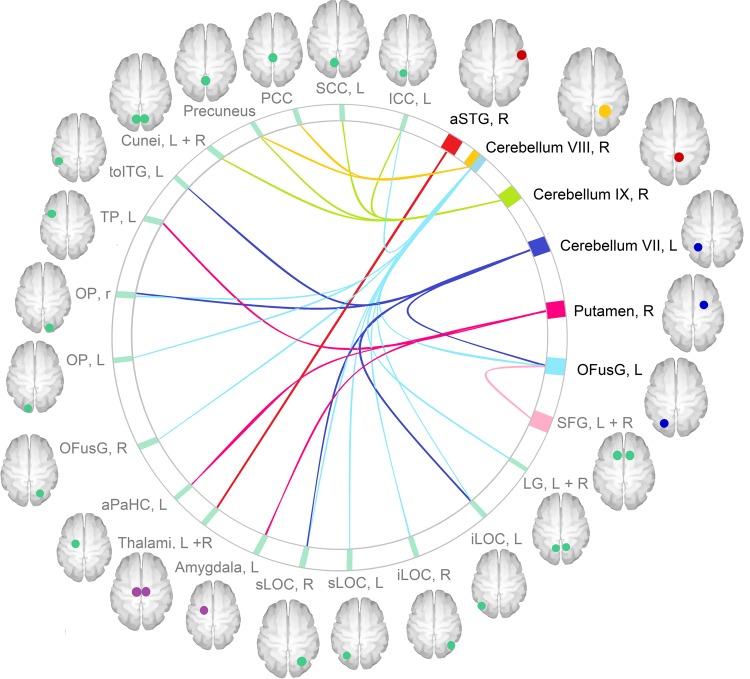
Fig. 3. Functional connectivity in patients vs controls.
The figure summarizes group differences in seed-to-target functional connectivity when viewing picture of high calories vs low calories food. The seeds with greater connectivity in patients compared with controls are represented in red; the seeds with lower connectivity in patients are represented in blue; the target regions are represented in green. The cerebellar lobule VIII, R is represented in orange as it showed both increased and reduced connectivity to different target regions. The image was created with CONN toolbox. The target regions are depicted as circles merely for representative purposes. The exact peak coordinates and voxel extent of each target cluster are reported in Table 2. aPaHC anterior parahippocampal cortex, aSTG anterior superior temporal gyrus, ICC intracalcarine cortex, iLOC inferior lateral occipital cortex, L left, LG lingual gyri, OFusG occipital fusiform gyrus, OP occipital pole, PCC posterior cingular cortex, R right, SCC supracalcarine cortex, SFG superior frontal gyri, sLOC superior lateral occipital cortex, toITG temporo-occipital inferior temporal gyrus, TP temporal pole

