Fig. 6.
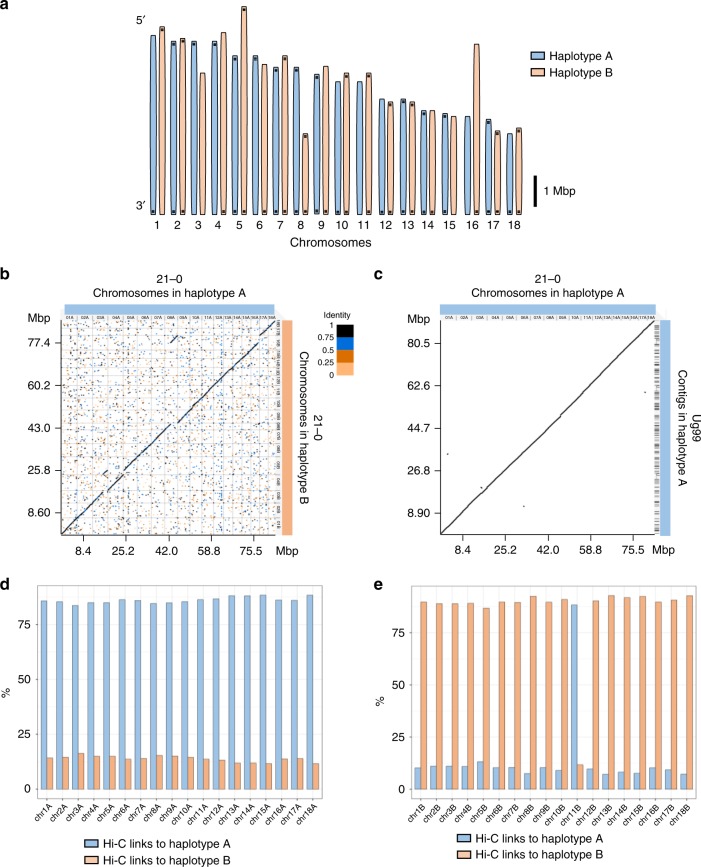
Chromosome sets of haplotype A and B in Pgt21-0. a Schematic representation of assembled chromosomes for Pgt21-0 of each haplotype (scale bar = 1 Mbp). Horizontal bars indicate telomeric repeat sequences. b Dot plot of sequence alignment of Pgt21-0 chromosome pseudomolecules of haplotypes A and B. Two translocation events, one between chromosomes 3 and 5 and one between chromosomes 8 and 16, are evident. c Dot plot of sequence alignment between chromosomes from haplotype A in Pgt21-0 and contigs from haplotype A in Ug99. d Percentage of Hi-C read pairs linking each A haplotype chromosome to other A chromosomes (blue) or to B haplotype chromosomes (orange). e Percentage of Hi-C read pairs linking each B haplotype chromosome to either A (blue) or B (orange) chromosomes

