Fig. 8.
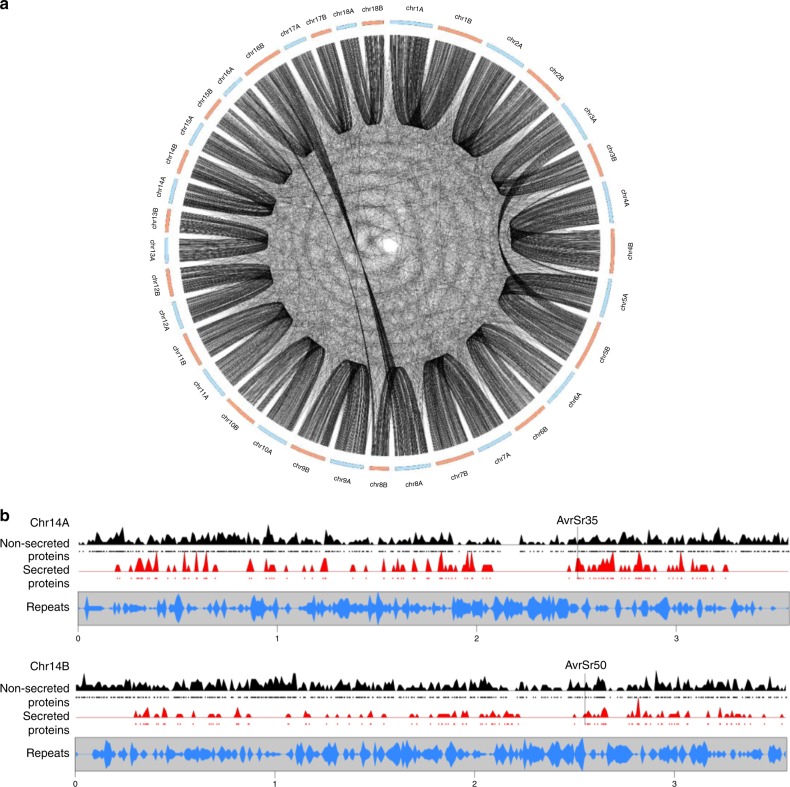
Gene content of Pgt21-0 chromosome pseudomolecules. a Circos plot showing location of orthologous gene pairs in the A and B chromosomes of Pgt21-0. b Gene and repeat density plots for homologous chromosomes 14 A and 14B. Density of genes encoding non-secreted (black) or secreted proteins (red) along the chromosomes are shown, with individual genes indicated by black or red dots. Bottom graph shows density of repeat elements (blue). Positions of AvrSr50 and AvrSr35 genes are indicated

