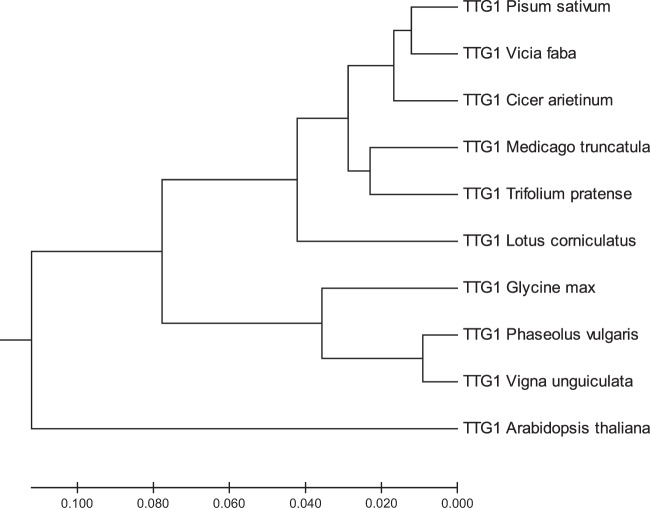
Figure 3.
Phylogenetic tree analysis of TTG1 proteins from faba bean (Vicia faba L.) and other plant species. The analysis was based on amino acid homology. The ten accessions sequences used were: P. sativum (ADQ27310), C. arietinum (XP_004502764), M. truncatula (XP_003602392), T. pratense (PNX92996), L. corniculatus (ARK19314), G. max (XP_003523314), P. vulgaris (XP_007136431), V. unguiculata (XP_027942759) and A. thaliana (NP_197840). The optimal tree with the sum of branch length = 0.46937337 is shown. The tree is drawn to scale, with branch lengths in the same units as those of the evolutionary distances used to infer the phylogenetic tree. Evolutionary analyses were conducted in MEGA7.

