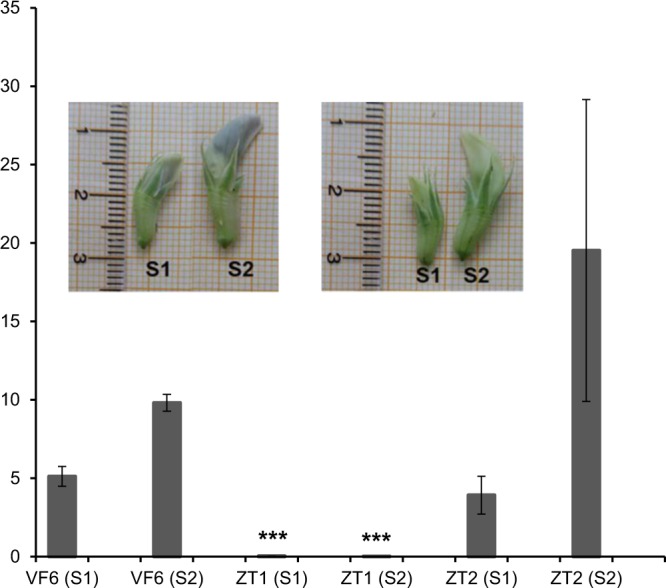
Figure 4.

Bar graph representing the expression profiles of VfTTG1 in the wild flowered line Vf6 and in the white flowered zt1 and zt2 lines, at different developmental stages (S1 and S2). Relative mRNA quantification was performed using CYP2 and ELF1A, as reference genes for normalization. Transcripts levels were analysed in two biological replicates. ***Denotes P < 0.001 statistically highly significant vs the other samples (ANOVA test). The error bars indicate the SEM (standard error of the mean).
