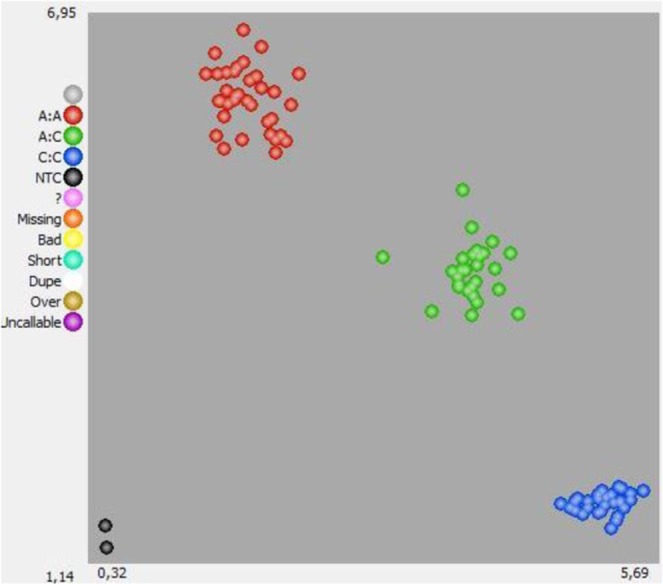
Figure 5.

KASP genotyping results of marker KASP_TTG1 in the two faba bean sets (A,B). The scatter plot with axes x and y shows the allelic discrimination of the accessions that clustered into three different groups: FAM homozygotes (blue), HEX homozygotes (red), and FAM/HEX heterozygotes (green). No-template controls (NTC). Allele “A”, in red, co-segregates with wild and zt2 genotypes while allele “C”, in blue, corresponds to the zt1 haplotype and line 13.
