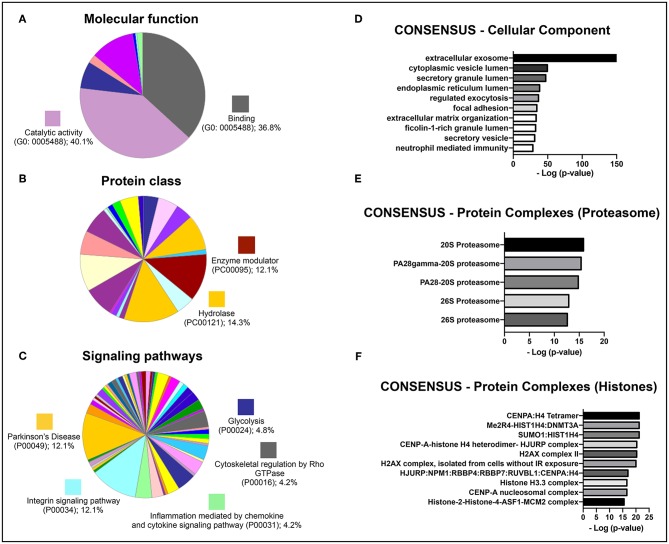
Figure 6.
Gene ontology analyses of the identified proteins in a proteomic analysis of the hBMSCs secretome from three independent donors. Categorization of the most represented (A) molecular functions, (B) protein classes, and (C) signaling pathways, using the PANTHER software (gene ontology levels 2 and 3). Results are shown as the percentage of proteins that are part of each individual GO category. Categorization of the enrichment of (D) cellular components, (E) elements of the proteasome and (F) elements of histones, using the ConsensusPathDB software (gene ontology levels 4 and 5). Results are shown as the –log of the p-value for the enrichment of each individual category.

