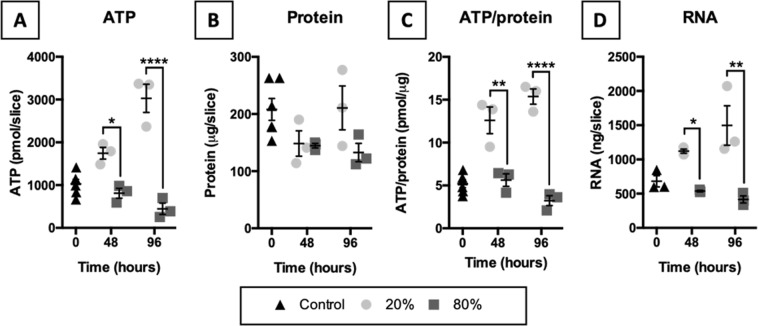
Figure 1.
Characterization of general viability markers. Slices were collected after slicing (0 h) and after 48 or 96 h of incubation at either 20 or 80% O2 (n = 3-6). ATP (A), protein (B), ATP/protein (C), and RNA (D) content in slices was measured to identify potential changes in viability. Values represent individual experiments performed in triplicate and are accompanied with the arithmetic mean (horizontal line) ± standard error of the mean (error bars). (*p < 0.05, **p < 0.01, and ****p < 0.0001).

