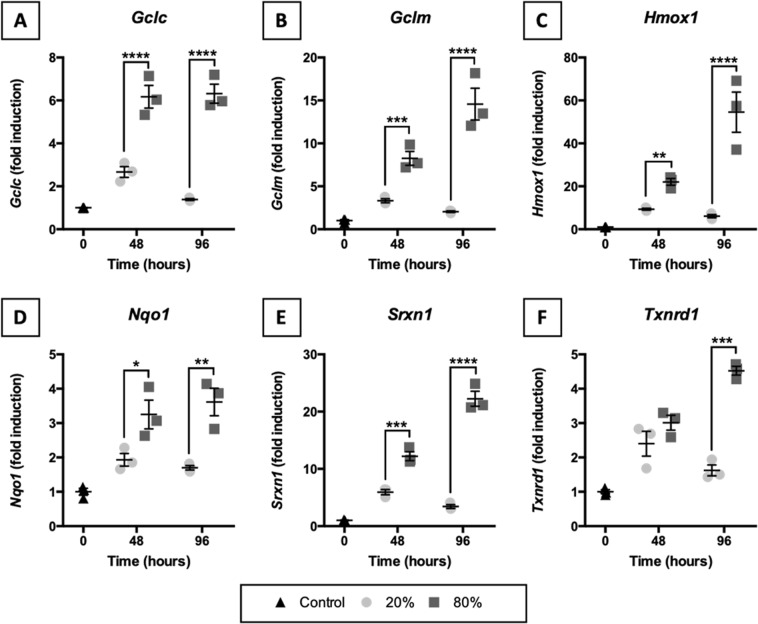
Figure 5.
Transcription of NRF2-downstream target genes. Slices were sampled after slicing (0 h) and after 48 or 96 h of incubation at either 20 or 80% O2 (n = 3). qPCR was used to analyze Gclc (A), Gclm (B), Hmox1 (C), Nqo1 (D), Srxn1 (E), and Txnrd1 (F) mRNA expression because they are NRF2-downstream target genes. Values represent individual experiments performed in triplicate and are accompanied with the arithmetic mean (horizontal line) ± standard error of the mean (error bars). (*p < 0.05, **p < 0.01, ***p < 0.001, and ****p < 0.0001).

