Figure 1.
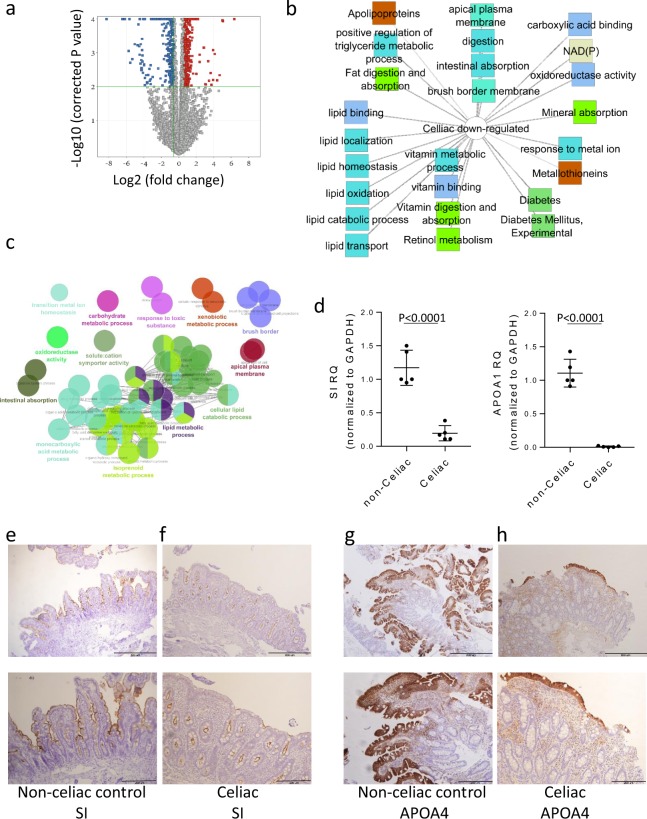
The core genes and pathways of newly diagnosed celiac disease emphasize reduced mature epithelial metabolic functions. (a) Volcano plot of the 878 differentially expressed genes between 23 celiac and 15 Ctl samples in the discovery cohort (FC ≥1.5 and FDR <0.05). Functional annotation enrichment analyses of the 354 down-regulated celiac core genes using ToppGene17/ToppCluster18 (b) and ClueGO19 (c), and visualized using Cytoscape20. In B, GO Biological Process, Cellular Component, and Molecular Function (blue), pathways (light green), gene family (brown), and disease (dark green). The full list of gene set enrichment results and P values are in Supplementary Dataset 1. (d) Relative quantification values (Rq, mean with SD) of APOA1 and SI mRNA after GAPDH normalization for controls (n = 5) and celiac (n = 5) with two-tailed T-test p values. Immunohistochemistry stains of duodenal epithelia brush border SI (e, f) and cytoplasmic APOA4 (g, h) for Ctl (e, g, n = 5) and celiac (f, h, n = 5). Ctl (e) subject show relatively higher brush border SI stain than celiac (f) that correlated with reads per million (RPM) values of 74 and 25 respectively. Ctl (f) subject show relatively higher APOA4 stain than celiac (h) that correlated with RPM values of 194 and 19 respectively. Lower image is inlet of the upper image that were recorded at 20x magnification. Scale bar represents 200 and 500 microns.

