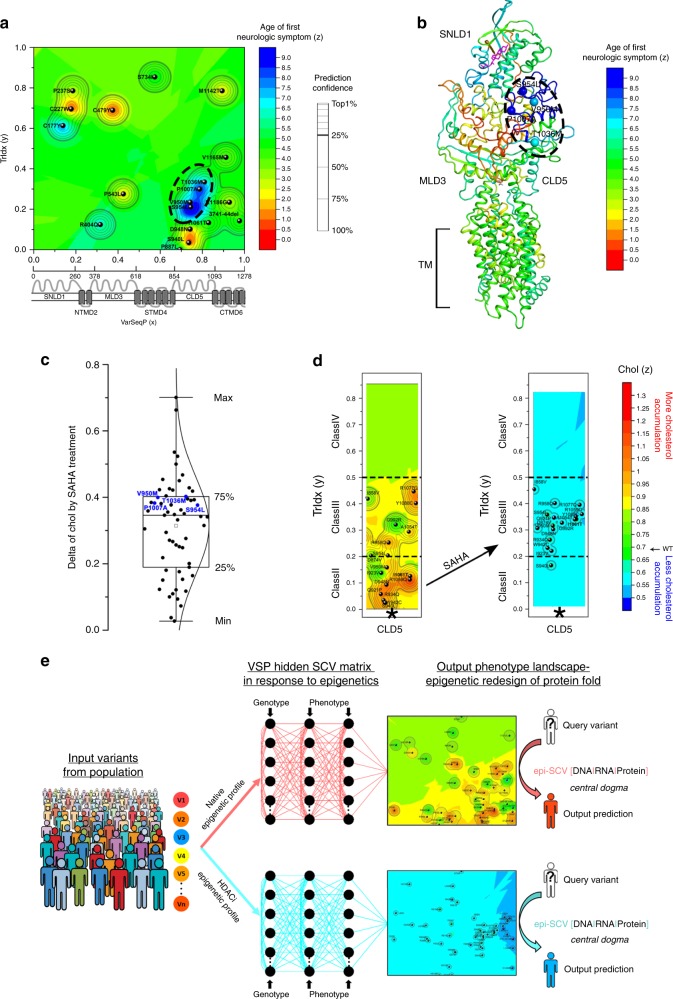
Fig. 6.
VSP links bench to bedside. a 19 variants from 27 patients with natural history information (Supplementary Table 3) are used as input value for VSP to generate the ANO-phenotype landscape that uses variant position information (x-axis) and cell-based TrIdx measurement (y-axis) to predict the ANO in the clinic (z-axis, color scale). The SCV cluster with late ANO (cyan-blue) in top 25% quartile of prediction confidence is highlighted by dashed oval. b The predicted ANO with highest confidence for each residue is mapped on the structure with the color code the same as panel (a). Variants with late ANO are shown in balls and labeled. c Distribution of the delta value of cholesterol homeostasis in response to SAHA for all the variants tested21. The variants with late ANO in the SCV cluster are shown in blue and labeled. d The Chol-phenotype landscape of CLD5 (Fig. 3c, asterisks) are shown with the TrIdx classes highlighted by dash lines. Black arrow indicates the TrIdx and Chol shift of class II CLD5 variants to class III in response to SAHA. e HDACi remodels the SCV relationships to manage genotype to phenotype transformation. Addition of HDACi to the same collection of variants from NPC1 population creates a new SCV matrix linking genotype to phenotype. VSP captures the impact of these epigenetic changes through SCV matrices to interpret and predict the dynamics of protein fold for its function in the context of local epigenetic environment. The epigenetic modulation of SCV (epi-SCV in the figure) provides a quantitative platform to characterize the ability of the environment to manage the information flow through central dogma (epi-SCV[DNA|RNA|Protein])

