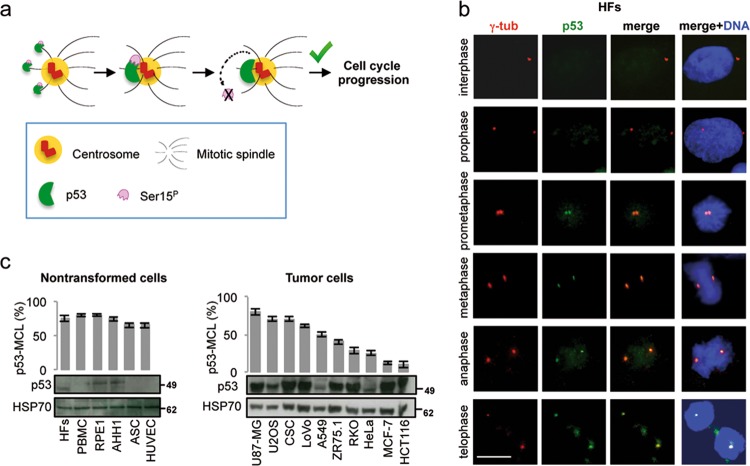
Fig. 1. p53-MCL in human cells.
a Schematic representation of p53-MCL as previously described23. At each mitosis during spindle formation, p53 is phosphorylated at Ser15 by ATM and, through MTs moves to centrosomes where it is suddenly dephosphorylated to allow cell-cycle progression. Only one of the two spindle pole is represented. b Proliferating, unsynchronized human immortalized fibroblasts (HFs) were fixed and immunostained for the indicated proteins. DNA was stained with HOECHST-33342 to identify mitoses. Representative images of the indicated phases of the cell cycle show that endogenous p53 colocalizes with γ-tubulin from prometaphase to telophase, but not in interphase (none out of > 500 interphases analyzed). c Proliferating, unsynchronized cells of the indicated lines were grown on coverslips, fixed, and stained as in (b). For each coverslip, > 200 mitotic cells (n > 200 mitoses) were analyzed to measure p53-MCL (i.e., the percentage of mitotic cells in which endogenous p53 colocalizes with γ-tubulin at both centrosomes). Histograms show the percentage of p53-MCL in a series of human nontransformed and tumor cells. Below histograms are the relative immunoblots performed on total cell extracts (TCEs) from the indicated cells to evaluate their p53 amount. Scale bars, 10 µm

