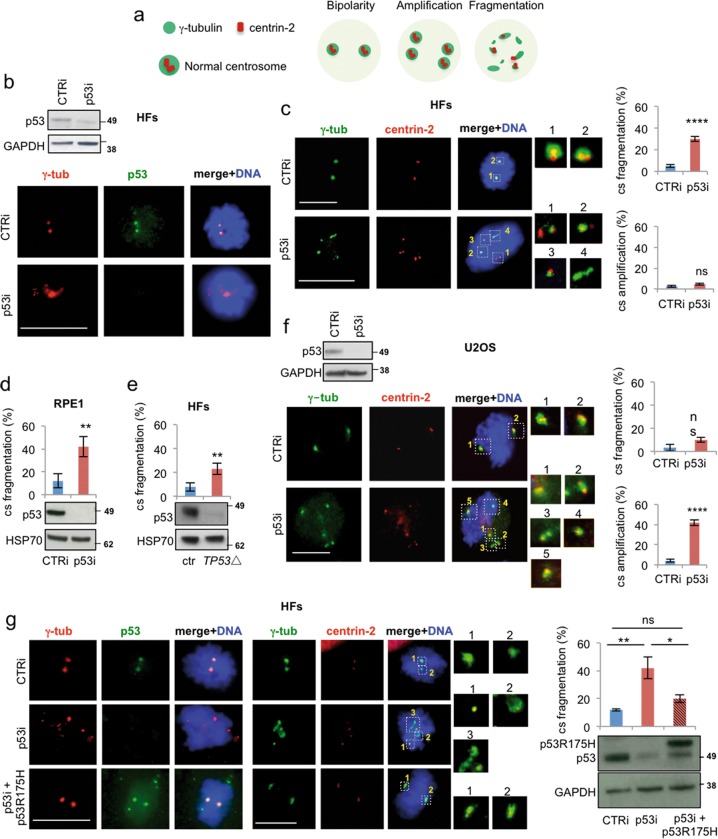
Fig. 2. Acute deletion of p53 induces centrosome fragmentation in human nontransformed cells.
a Schematic representation of centrosome conditions (i.e., physiological bipolarity and pathological amplification and fragmentation) as they can be detected by double IF with anti-γ-tubulin and anti-centrin-2 Abs. b Endogenous p53 expression was depleted by p53 siRNA (p53i) in nontransformed HFs. Control (CTRi) and p53i cells were analyzed 48 h post-transfection by WB and double IF for γ-tubulin/p53. c The same cells reported in (b) were analyzed for centrosome number and structure by IF for γ-tubulin and centrin-2. Representative images with enlarged centrosomes or centrosomal material are reported. Quantifications of the IF images (n = 600 mitoses) are reported in the histograms. No significant accumulation of cells with numeral centrosomal defects (cs amplification) is observed. In contrast, strongly significant accumulation of mitoses with centrosome fragmentation is observed in p53i HFs. d RPE1 cells were transfected with CTRi and p53i and analyzed as the HFs described in (b and c). WB analysis and quantification of centrosome fragmentation are reported. e Endogenous p53 expression was depleted in HFs by transient CRISPR/Cas9 transfection (TP53Δ) and analyzed as in (b) and (c). WB and quantification of centrosome fragmentation are reported. f U2OS cells were transfected and analyzed as in (b) and (c) (n = 400 mitoses). In contrast to nontransformed HFs, U2OS tumor cells show centrosome amplification with no centrosome fragmentation. g CTRi and p53i HFs were transfected with the transcription-defective p53R175H mutant and p53 protein expression analyzed by WB on TCEs. Cells from the same experiments were fixed and analyzed by double IF for γ-tubulin/p53 and γ-tubulin/centrin-2 (n = 300 mitoses). Representative IF images and quantification of centrosome fragmentation are reported. Data show that p53R175H localizes at the centrosomes and significantly reduces their fragmentation in p53i HFs. No effects, at the centrosome level, were induced by p53R175H expression in CTRi HFs. Each experiment was repeated at least three times. Scale bars, 10 µm. ns = not significant; *P < 0.05; **P < 0.01; ***P < 0.001; ****P < 0.0001

