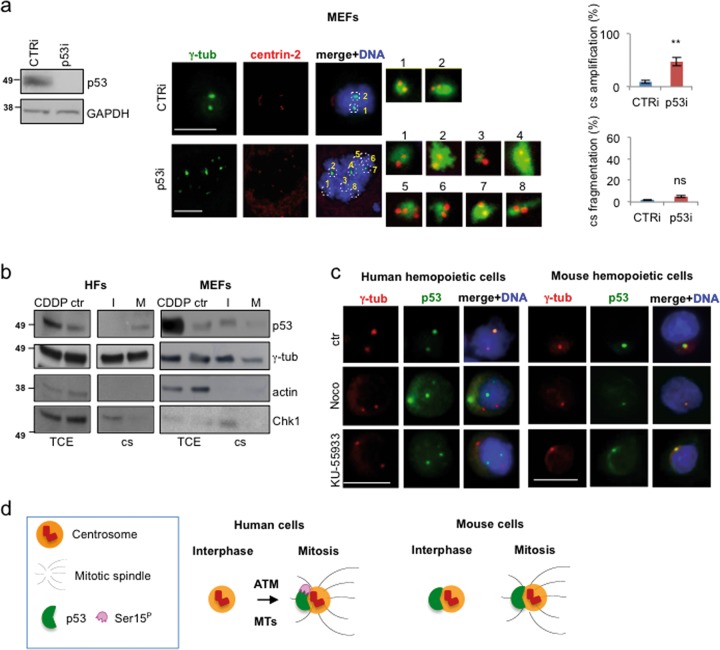
Fig. 4. p53 centrosomal localization in mouse cells.
a MEFs were transfected with CTRi and p53i-specific siRNAs and analyzed by double IF for γ-tubulin/centrin-2 to evaluated centrosome number and structure as described above for human cells. WB analysis of TCEs shows depletion of p53 protein level. Representative IF images with enlarged centrosomes on the right show the normal structure of the centrosomes. Histograms show the percentage of p53i MEFs (n = 600) with centrosome amplification, compared to CTRi cells (n = 400). In contrast to human nontransformed cells, no centrosome fragmentation is detected. This experiment was repeated twice in duplicate. ns = not significant. *P < 0.05; **P < 0.01. Scale bars, 10 µm. b Immunoblots of the indicated proteins were performed on lysates from isolated centrosomes (cs) purified from interphase (I) and mitotic (M) enriched human (HFs) and mouse (MEFs) fibroblasts. The following controls were performed: (i) TCE of untreated or cisplatin (CDDP)-treated cells were used as p53 detection control; (ii) γ-tubulin was used as constitutive centrosomal marker; (iii) actin, that never localizes at the centrosome, as centrosome purification control; (iv) Chk1, that does not localize at the centrosome in mitosis, was used as purification control of mitotic centrosomes. p53-MCL was confirmed in human cells while mouse p53 is present at the centrosomes both in interphase and mitosis. This experiment was repeated four times. Images of a representative experiment are shown. c Representative IF images of human (AHH1) and mouse (32D) hemopoietic cells solvent-treated (ctr) or treated with nocodazole, to inhibit MTs, and KU-55933, to inhibit ATM. In contrast to human cells that were used as positive control (e.g., p53-MCL declines from 79 ± 3 to 15 ± 2% with nocodazole and to 10 ± 4% with KU-55933 in the reported experiment), mouse cells showed a p53 centrosomal localization independent of both MT dynamics (p53/γ-tubulin colocalization = 85 ± 3%) and ATM activity (p53/γ-tubulin colocalization = 83 ± 3%). Experiments were reproduced at least three times in duplicate and at least 200 cells per sample analyzed. Scale bars, 10 µm. d Schematic representation of the different centrosomal localization of p53 in human and mouse cells

