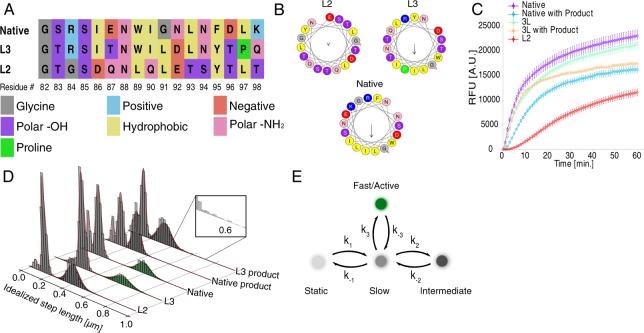
Figure 2.
Quantifications of the effect of mutations on TLL activity and diffusional state sampling. (A) Sequence alignment of the 3 variants used, color coding denotes the charge or polarity or type of the amino acids. (B) Helical wheel representation of all mutations on lid structures generated using HELIQUEST72. Native and L3 variants display several larger hydrophobic residues and a relatively high hydrophobic moment compared to L2, which contains less and smaller hydrophobic residues. (C) Bulk activity of lipase mutants reveals Native and L3 to display practically identical high activity. L2 displays intermediate activity. Product addition (2% myristic acid) results in inhibition and partial loss of activity. Product inhibition is stronger on native as compared to L3 variant. (D) Histograms of step sizes and underlying diffusional states provided by Hidden Markov analysis, see Supplementary Methods M2–M4 for HMM analysis and fitting methodology. Each of the tested lipase variants reversibly transits between 3 diffusional states. The slow and the practically static states (peaks at 0.1 µm and 0.05 µm respectively) appear to be sampled by all variants. Faster state appears to correlate with activity: the higher the activity of the mutant the higher the diffusion coefficient of the fast state. L2 operates via sampling an intermediate mobility state. Product inhibition and mutations lowering activity. (E) Proposed model with four underlying states conserved between mutants. Each mutant may sequential sample up to three states within the experimental time frame, the static and slow and either the fast or the intermediate.

