Fig. 4.
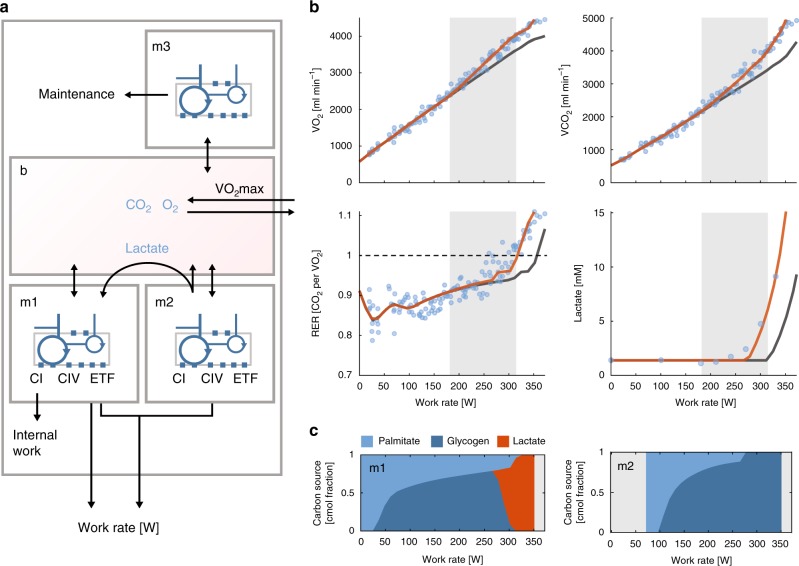
The effects of complex I bypass in a multi-tissue model. a Schematic representation of the multi-tissue model. Three genome-scale models corresponding to muscle fibers with high mitochondrial content (type I fibers, m1), intermediary mitochondrial content (type II fibers, m2), and peripheral tissues (m3) were joined by a shared extracellular compartment (b) resembling transport through the blood stream. The flux through ETF, CI, and CIV was constrained in m1 and m2, and scaled by a constant to allow for differences in enzyme concentrations between subjects. b It was possible to fit the model (orange line) to experimentally observed VO2 and VCO2 data (blue circles) from a subject performing incremental exercise on a bike. The lactate concentrations in blood, which was obtained for the same subject at a different occasion, could also be fitted assuming a Michaelis–Menten relation between the concentration and the predicted lactate flux. The fit for the model with complex I bypass was better than for a model without (gray line). The oxygen expenditure was highest in a region (indicated with gray shading) between complex I bypass and before lactate accumulation, as given by RER > 1 (dashed line). c Relative substrate utilization in the two muscle fiber sub-models (cmol) showed a shift from fatty acids as carbon source towards glycogen. After complex IV was saturated in m2 the model predicted a flux of lactate from m2 to m1

