Fig. 5.
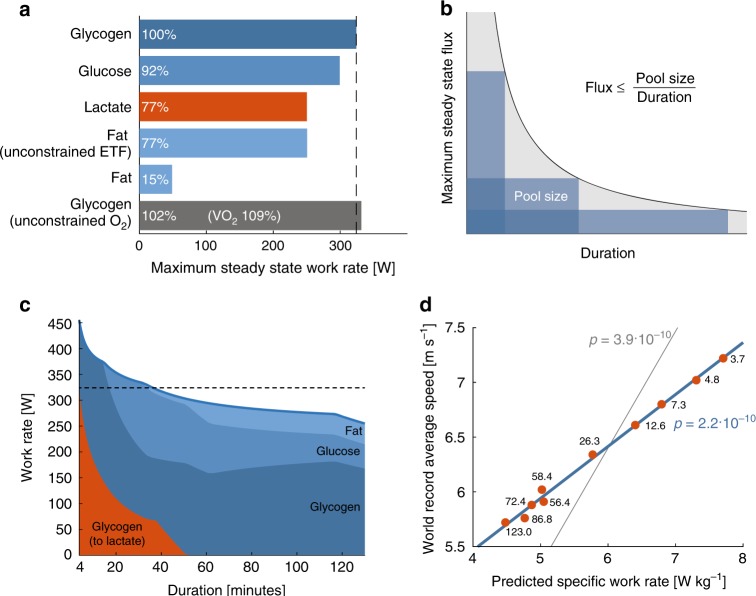
Maximum work capacity on different substrates and at different durations. a There are differences in the maximum predicted work rate for different carbon sources, assuming unconstrained uptake. b The maximum steady-state flux is constrained by exercise duration, assuming substrates are depleted at the end of the exercise. c The maximum attainable work rate for a given exercise duration with maximum steady-state work rate (dashed line) for the reference. The colored regions show the relative flux of carbon on a carbon mol basis. d The decrease in running speed at increasing distances may largely be explained by limited metabolite pool sizes. There is a linear relation between the predicted maximum specific work rate (predicted work rate per kg bodyweight) at different durations and the world-record average running speeds at these durations (3.7–123 min), regression without intercept (gray line) and with intercept (blue line), p-value from the t-statistic of the slope

