Figure 1.
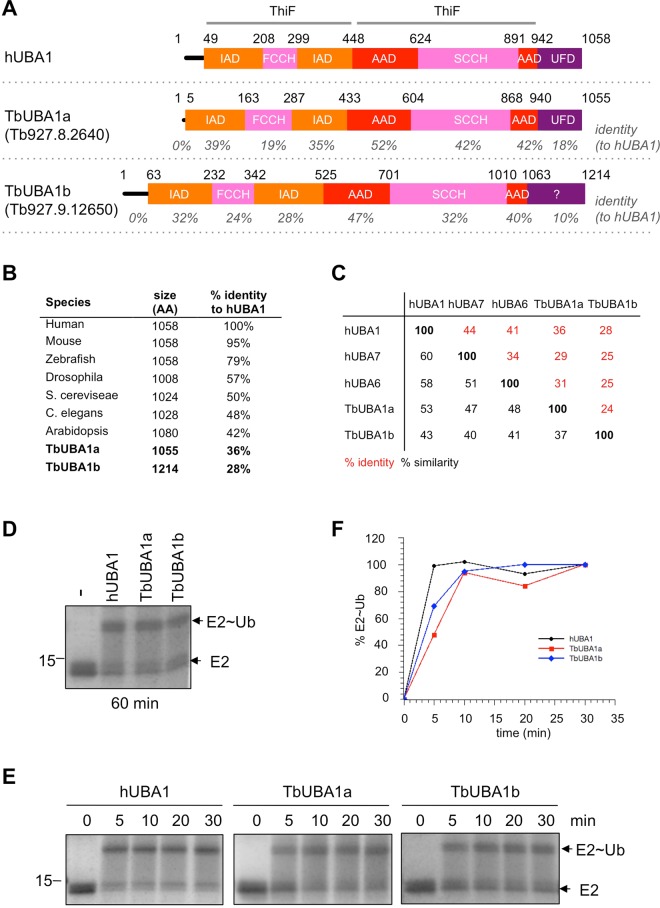
T. brucei expresses two UBA1 proteins, TbUBA1a and TbUBA1b. (A) Schematic representation of UBA1 proteins showing the domain organization, with domain boundaries indicated above. ThiF refers to the ThiF/MoeB Pfam motif PF00899 by which E1 proteins can be identified. The amino acid identity with hUBA1 was calculated for each domain separately based on pair-wise alignments (listed in grey). (B) For the UBA1 orthologues of the indicated species, protein length is indicated as well as the amino acid identity to hUBA1 based on pair-wise alignments. UniprotKB accession numbers: P22314 (human); Q02053 (mouse); F1RCA1 (zebrafish); O46111 (Drosophila); P22515 (S. cerevisiae); Q3S1J5 (C. elegans); P93028 (Arabidposis); Q57XC5 (TbUBA1a); Q38DE8 (TbUBA1b). (C) percentage amino acid sequence identity (in red) and similarity (in black) for the indicated proteins based on pair-wise alignments. (D) E1-E2 transthioesterification reactions in the absence (−) or presence of equivalent amounts of the indicated UBA1 proteins. Reactions were run for 60 min. E1 activity was determined by the transfer of ubiquitin to the E2 (UbcH5a). Indicated are free E2 (E2) and the E2-ubiquitin conjugate (E2~Ub). Shown are Coomassie stained gels, with the position of the 15 kD Mr marker band indicated on the left. (E) E1-E2 transthioesterification reactions with the indicated UBA1s. Samples were taken before the start of the reaction (0) and after the start of the reaction at the indicated times. Analysis as in (D). Reactions were run on separate gels. For full length gels, see Supplementary Information. (F) Quantification of the experiment shown in (E). For each protein, the E2~Ub as a percentage of the total E2 [E2~Ub/(E2 + E2~Ub)] was calculated. The percentage at 30 min was set at 100%, and the percentages at other time points were calculated relative to this.

