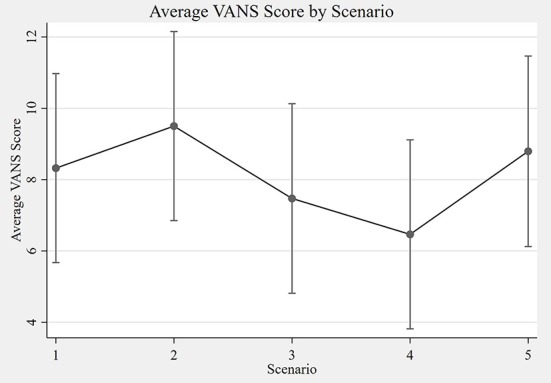
Figure 5.

Average VANS score by scenario. The graph depicts the average VANS score by scenario with 95% confidence intervals. From left to right the mean VANS scores were as follows: A = 8.3; B = 9.5; C = 7.5; D = 6.5; E = 8.8. Please see Table 1 for a description of the scenarios A–E. VANS, VA Neuropathy Scale.
