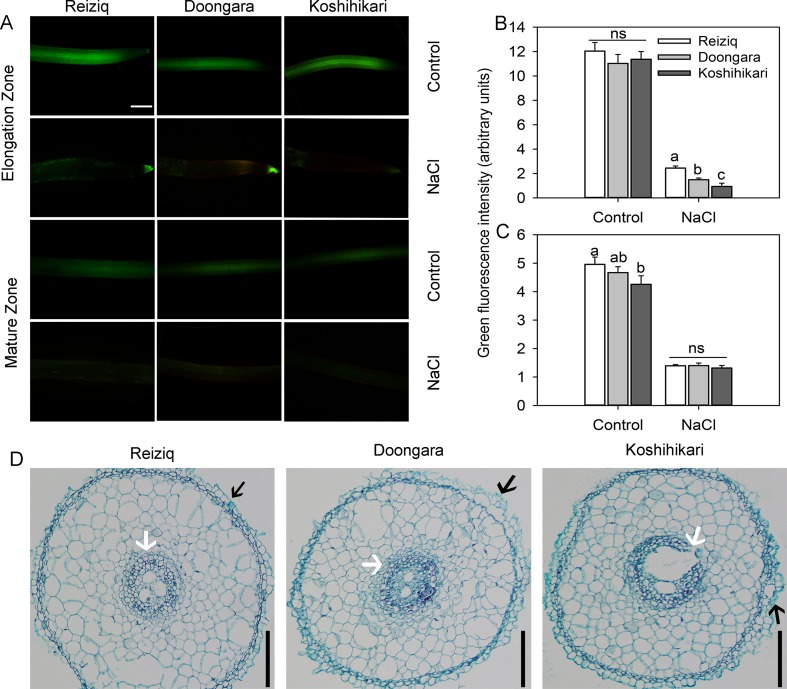
Figure 3.
Viability staining of the elongation and mature root zones of the three rice cultivars exposed to 100 mM NaCl for 48 h. (A) One typical image is shown for each treatment/cultivar, bars = 100 μm. The intensity of the green fluorescent signal represents the root cell viability in the elongation (B) and mature (C) zones. Values are the mean ± SE (n = 15–20). (D) Anatomical structure in the rice root elongation zone (1.5 mm from the root apex) after the treatment of 100 mM NaCl for 48 h, bars = 50 μm. The black arrow indicates exfoliated root epidermis cells. The white arrow indicates a protective gap formed between the cortex cells and pericycle cells. Data labeled by different letters are significantly different at P < 0.05; ns, nonsignificant.

