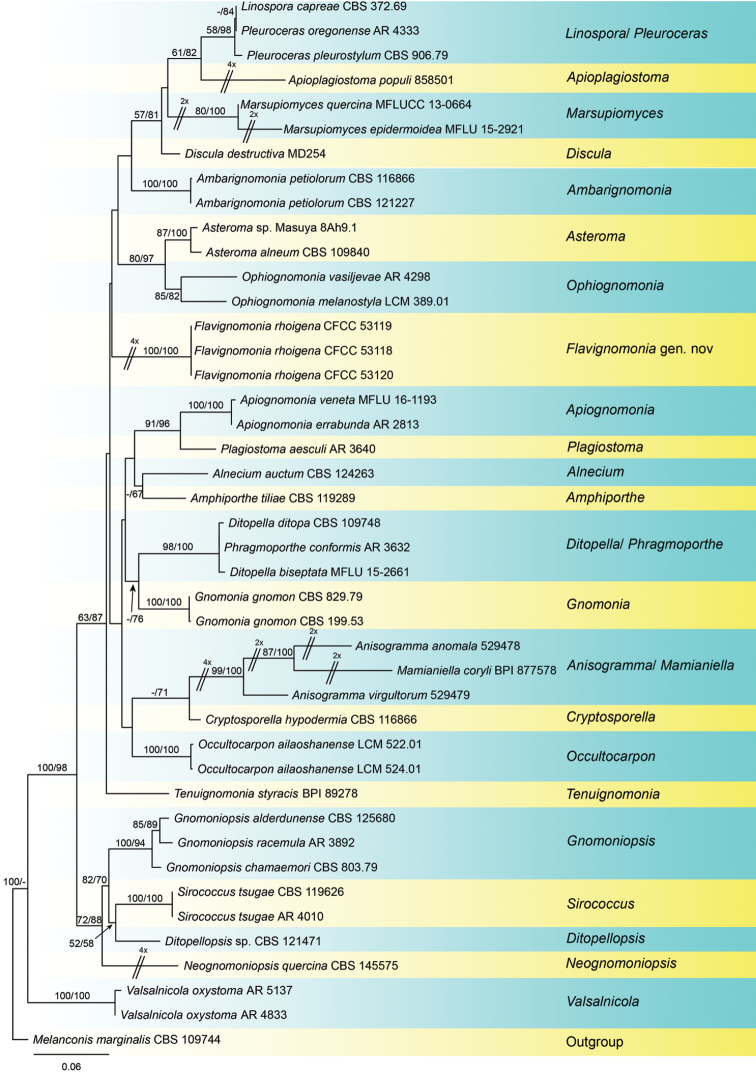
Figure 1.
Phylogenetic tree based on an ML analysis of a combined DNA dataset of ITS, LSU, tef1 and rpb2 gene sequences for all genera with DNA data and some species of Gnomoniaceae. Bootstrap values ≥ 50 % for MP and ML analyses are presented at the branches. The scale bar represents the number of changes per site.

