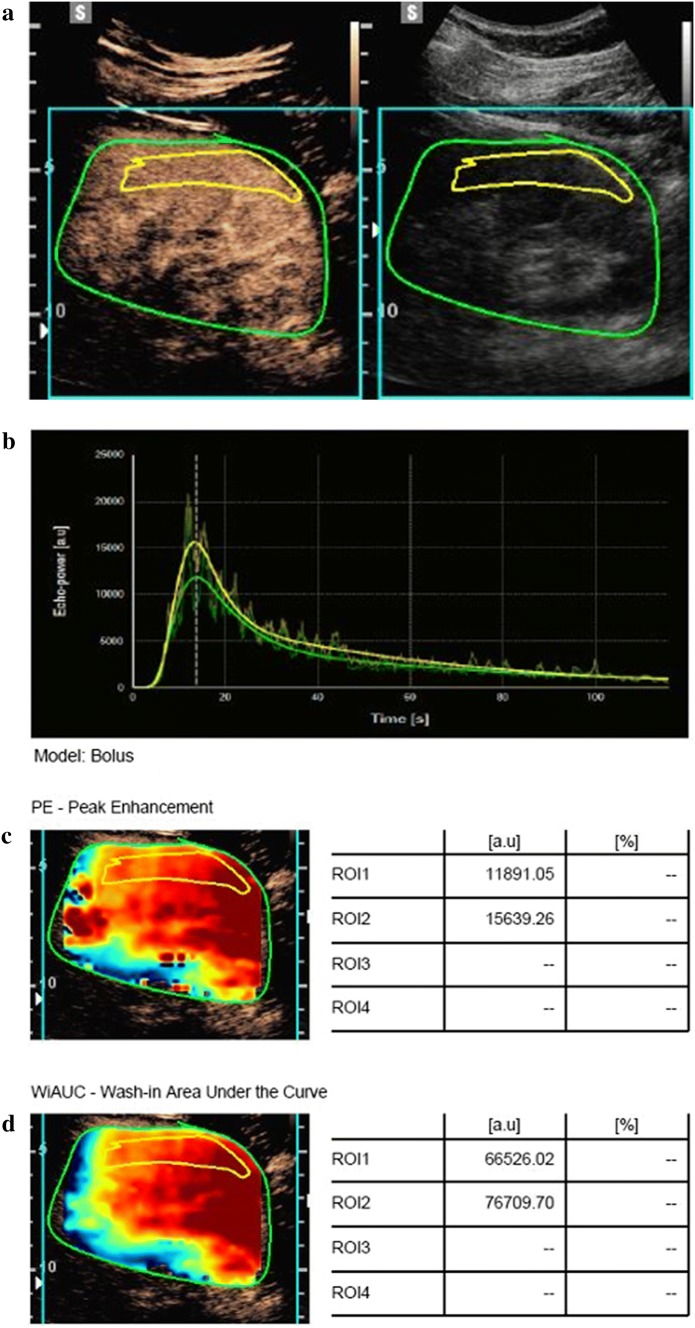
Fig. 2.
Representative images of CEUS analysis. a A region of interest was drawn (yellow line) in the largest possible area of the renal cortex close to the US. The green line corresponds to the overall zone (kidney and surrounding tissues). b The software generated a time intensity curve. This curve was used to generate CEUS-derived parameters. c and d Obtained representative parameters are shown. CEUS contrast-enhanced ultrasound, US ultrasound, PE peak enhancement, WiAUC wash-in area under the curve

