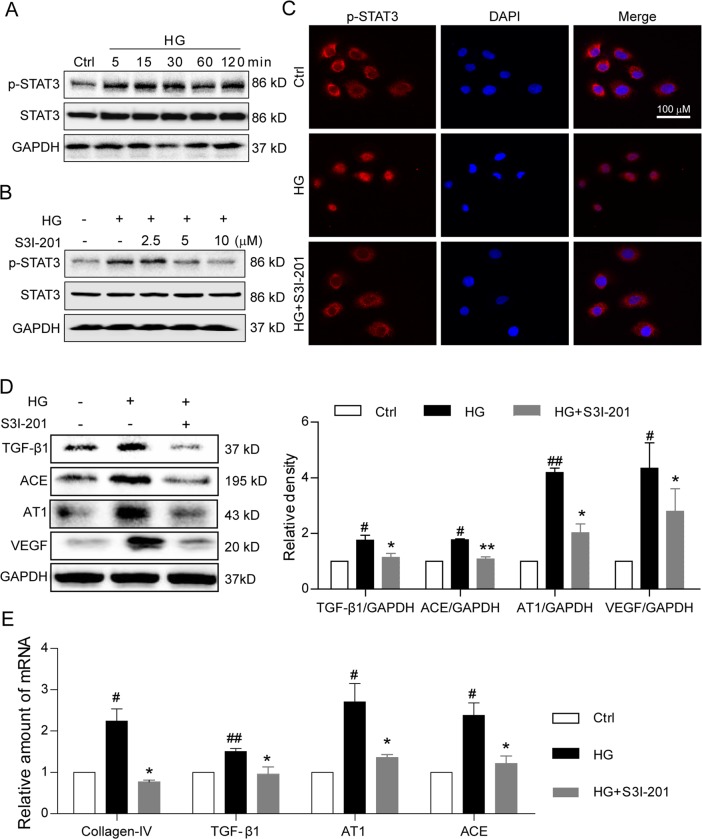
Fig. 6. S3I-201 inhibits high glucose-induced STAT3 activation and pro-fibrotic responses in rat renal tubular epithelial cell line.
a Time-course of STAT3 phosphorylation (Tyr-705) in rat renal tubular epithelial cells (NRK-52E) stimulated with high glucose (HG; 33 mM); shown is representative Western blot analysis, Ctrl = no glucose control, GAPDH = loading control, n = 4. b Effects of S3I-201 pretreatment on HG-induced STAT3 phosphorylation in NRK-52E cells. Cells were treated with S3I-201 (2.5, 5, and 10 µM) for 1 h, stimulated with HG 30 min, cells collected for Western blot analysis; shown is representative blot from four determinations. c For nuclear localization of p-STAT3, S3I-201 pretreated NRK-52E cells were stimulated with HG for 30 min, and immunofluorescence detection of p-STAT3 (red) evaluated (Methods), DAPI = nuclear fluorescence stain (blue), MERGE = overlaid images, n = 4. Scale bar = 100 μm; 600 × amplification. d, e Fibrosis-related proteins and signaling molecules were detected. Rat renal tubular epithelial cells (NRK-52E) were pretreated with S3I-201 (10 µM) for 1 h and stimulated with HG for 24 h. Representative western blot analysis of TGF-β1, ACE, AT1, and VEGF with GAPDH as loading control; corresponding densitometric analysis of blots, values normalized to loading control GAPDH and reported relative to Ctrl (d). Quantitative RT-PCR determination of Collagen IV, TGF-β1 AT1, and ACE mRNA, values normalized to house-keeping gene β-actin and reported relative to Ctrl (e). Data are represented as the mean ± SEM of four independent experiments; #p < 0.05, ##p < 0.01 versus Ctrl (DMSO control); *p < 0.05, **p < 0.01 versus HG group

