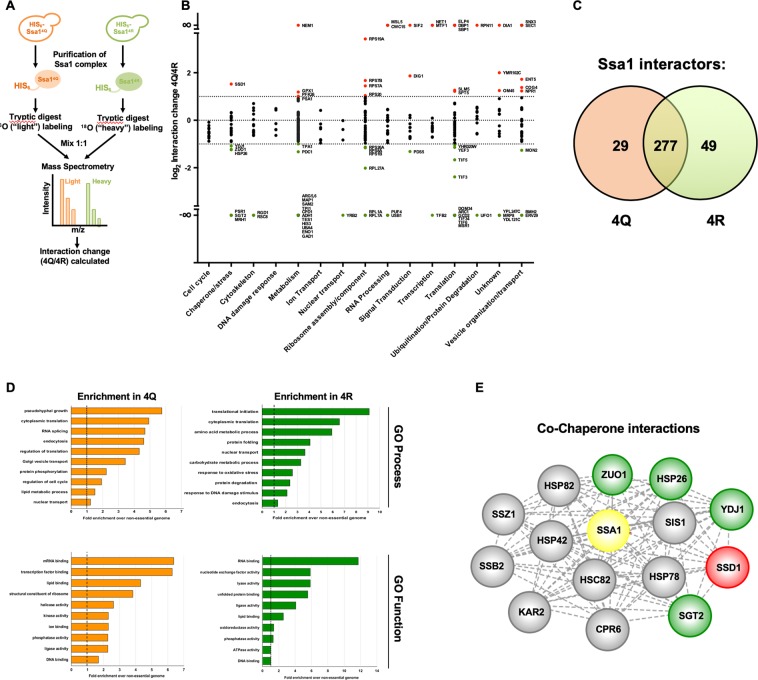
Figure 4.
Acetylation alters the interactome of Ssa1. (A) Scheme for proteomic analysis. Cells expressing 4Q or 4R mutant His6-Ssa1 were grown to exponential phase, whereupon Ssa1 complexes were affinity purified and digested with trypsin. Peptides from 4Q interactors were isotopically labeled with 18O, mixed 1:1 with 4R interactor peptides, and analyzed by quantitative LC-MS/MS. (B) Functional classification of the Ssa1 interactome. Ssa1 interactors were categorized by cellular function using Gene Ontology (GO) Slim analysis and plotted against relative affinity for 4Q vs 4R Ssa1. The dotted lines represent a ratio of two-fold. Interactors are colored by relative selectivity to 4Q or 4R Ssa1 as follows: red (significant selectivity for 4Q), green (significant selectivity for 4R), black (equal binding to 4Q and 4R). (C) Venn diagram of Ssa1 interactors observed in 4Q and 4R interactomes after applying statistical filters. (D) Gene Ontology (GO) term analysis of 4Q and 4R interactomes. Interactors were categorized by cellular function using GO Slim analysis and relative enrichment compared to occurrence in the non-essential genome was calculated. The top 10 enriched cellular processes and function are shown for both 4Q and 4R interactomes. (E) Analysis of chaperone/co-chaperone interactions of 4Q and 4R Ssa1. A network of the 15 co-chaperones and chaperones that were detected by mass spectrometry as interactors of 4Q and 4R Ssa1 was generated using Cytoscape. The nodes were colored based on relative binding preference for 4Q and 4R as follows: red (selectivity for 4Q), green (selectivity for 4R) and gray (no preference). Raw mass spectrometry data are available via ProteomeXchange with identifier PXD015185.

