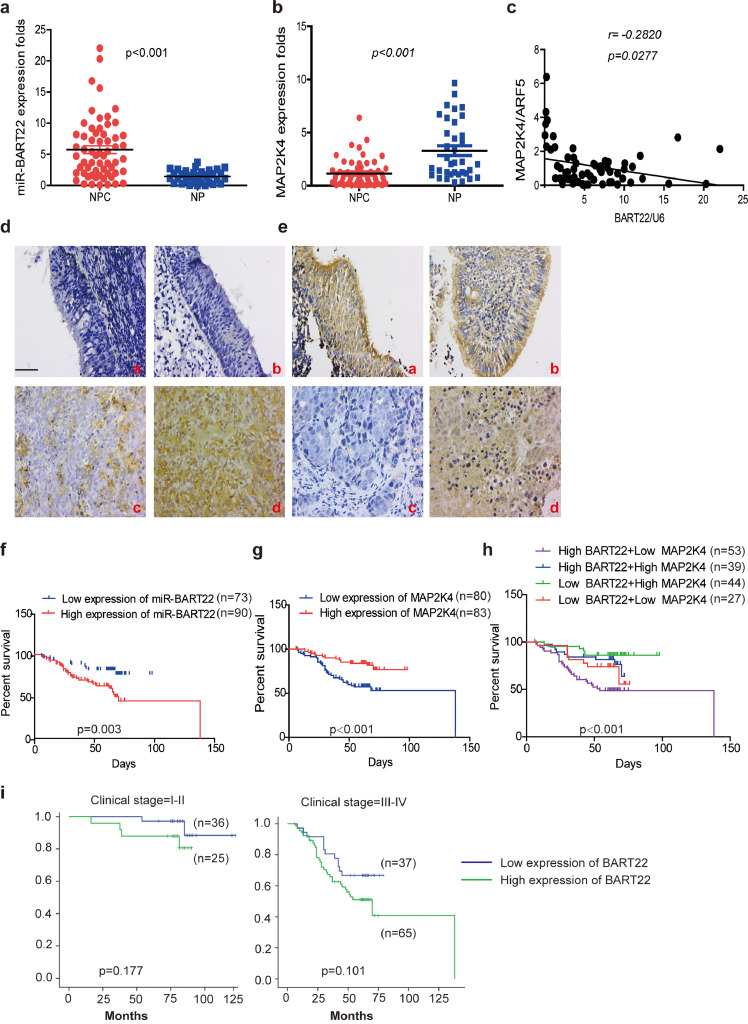
Fig. 7.
Increased EBV-miR-BART22 and decreased MAP2K4 expression in NPC.
(a)(b) The expression of EBV-miR-BART22 and MAP2K4 in NP and NPC samples was determined by qRT-PCR. Student's t-test, mean ± SD. (c) Correlations between miR-BART22 and MAP2K4 expression levles were calculated. Two tailed Spearman's correlation analysis. Means ±SD.,P = .0277. (d) miR-BART22 expression in NP and NPC samples. (a)(b)Negative expression in NP tissues; (c)weak positive expression of miR-BART22 in NPC samples. (d)strong positive expression of miR-BART22 in NPC samples(original magnification ×400,scale bar, 50 μm). (e) MAP2K4 expression in NP and NPC samples. (a)(b)strong staining of MAP2K4 in NP samples. (c)Negative expression in NPC samples; (d)positive expression in NPC samples(original magnification ×400,scale bar, 50 μm). (f)(g) Kaplan-Meier survival analysis of overall survival of 163 NPC patients on the basis of miR-BART22 and MAP2K4 expression.(log-rank test was used to calculate P values). (h) Kaplan-Meier survival analysis of overall survival in 163 NPC patients on the basis of low expression of miR-BART22 and high expression of MAP2K4. (log-rank test, P < .001). (i) Stratified analysis was used to analyze the correlation of the expression of miR-BART22 with survival prognosis in clinical stage(I-V) stage. (j) Stratified analysis was used to analyze the correlation of the expression of MAP2K4 with survival prognosis in clinical stage(I-V) stage.


