Figure 4.

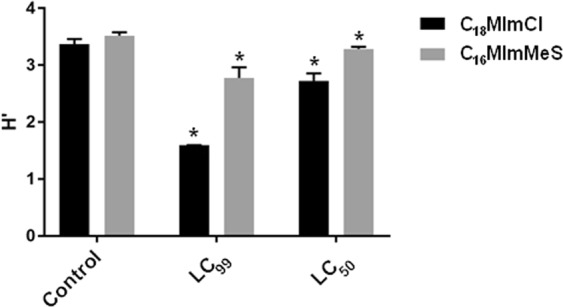
Shannon diversity index (H′) determined for the microbiota after the treatments of larvae with different IS concentrations. The bars represent standard deviations. *Represents significant difference compared to the control.

Shannon diversity index (H′) determined for the microbiota after the treatments of larvae with different IS concentrations. The bars represent standard deviations. *Represents significant difference compared to the control.