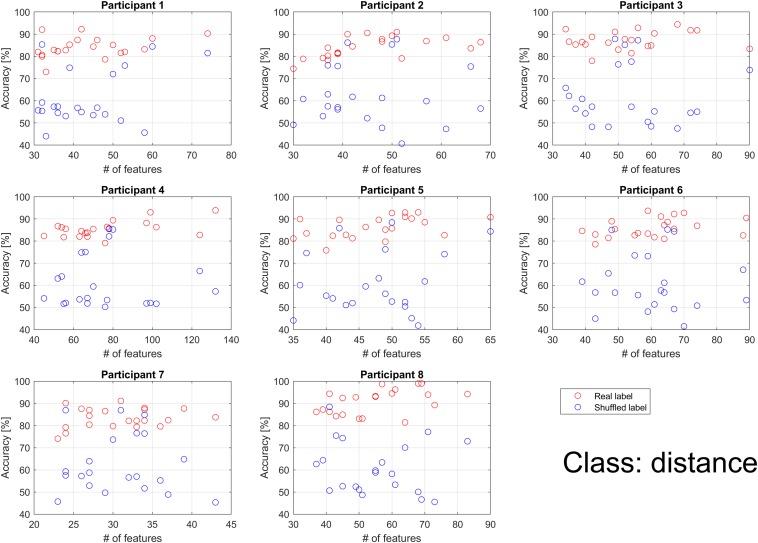
FIGURE 6.
Individual classification accuracies for distance according to the number of features. Each dot represents the accuracy for each binary classification. The binary classifications were performed 21 times (7 choose 2) per participant when the feature for all classifications had at least 1. Blue circles represent the result when shuffled labels were used. Red circles represent the result when real labels were used. Performance for the real label increased in proportion to the number of features, while performance for the shuffled label did not depend on the number of features.

