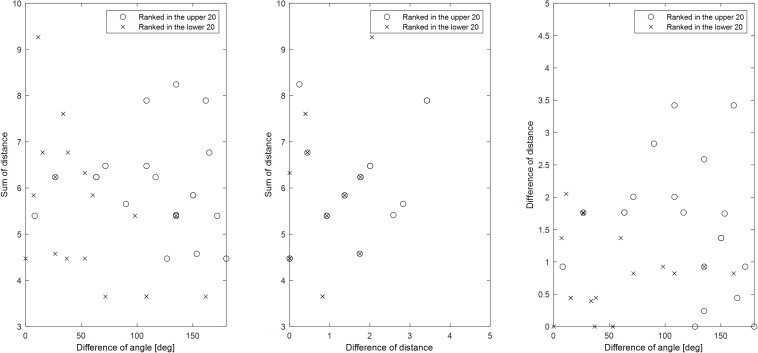
FIGURE 8.
Relationships among parameters comprising two classes for classifications achieving high or low accuracy when all movements were used as different classes. Mean values across all participants were used for sorting accuracy. If the number of features for the individual classification was 0, the classification accuracy was not included in the mean accuracy calculation. When all movements were used as a different class, there were 435 classifications. Based on mean accuracy, circles represent the top 20 among these 435 classifications, while crosses represent the bottom 20. The angle difference, distance difference, and sum of distances comprising each vector representing the class were investigated. Since differences in the direction of the two vectors can have two values, the smaller value was selected (range: 0–180 degrees).

